Article

Detection of QTLs Regulating Six Agronomic Traits of Rice Based on Chromosome Segment Substitution Lines of Common Wild Rice (Oryza rufipogon Griff.) and Mapping of qPH1.1 and qLMC6.1

1
State Key Laboratory for Conservation and Utilization of Subtropical Agro-Bioresources, College of Agriculture, Guangxi University, Nanning 530004, China
2
Graduate School of Green-Bio Science and Crop Biotech Institute, Kyung Hee University, Yongin 17104, Republic of Korea
3
Maize Research Institute, Guangxi Academy of Agricultural Science, Nanning 530007, China
4
State Key Laboratory of Conservation and Utilization of Subtropical Agro-Bioresources, College of Life Science and Technology, Guangxi University, Nanning 530005, China
*
Author to whom correspondence should be addressed.
Biomolecules 2022, 12(12), 1850; https://doi.org/10.3390/biom12121850
Submission received: 16 November 2022 / Revised: 6 December 2022 / Accepted: 7 December 2022 / Published: 11 December 2022
(This article belongs to the Special Issue Molecular-Genetic Basis of Plant Breeding 2.0)

Abstract

:
Wild rice is a primary source of genes that can be utilized to generate rice cultivars with advantageous traits. Chromosome segment substitution lines (CSSLs) are consisting of a set of consecutive and overlapping donor chromosome segments in a recipient’s genetic background. CSSLs are an ideal genetic population for mapping quantitative traits loci (QTLs). In this study, 59 CSSLs from the common wild rice (Oryza rufipogon Griff.) accession DP15 under the indica rice cultivar (O. sativa L. ssp. indica) variety 93-11 background were constructed through multiple backcrosses and marker-assisted selection (MAS). Through high-throughput whole genome re-sequencing (WGRS) of parental lines, 12,565 mapped InDels were identified and designed for polymorphic molecular markers. The 59 CSSLs library covered 91.72% of the genome of common wild rice accession DP15. The DP15-CSSLs displayed variation in six economic traits including grain length (GL), grain width (GW), thousand-grain weight (TGW), grain length-width ratio (GLWR), plant height (PH), and leaf margin color (LMC), which were finally attributed to 22 QTLs. A homozygous CSSL line and a purple leave margin CSSL line were selected to construct two secondary genetic populations for the QTLs mapping. Thus, the PH-controlling QTL qPH1.1 was mapped to a region of 4.31-Mb on chromosome 1, and the LMC-controlling QTL qLMC6.1 was mapped to a region of 370-kb on chromosome 6. Taken together, these identified novel QTLs/genes from common wild rice can potentially promote theoretical knowledge and genetic applications to rice breeders worldwide.

1. Introduction

Rice is a staple food for more than half of the world’s population, and improving its yield is vital for food security. Wild rice (Oryza rufipogon Griff.) has always been recognized as the ancestor species of Asian cultivated rice in the evolution, and a natural germplasm resource for generating elite cultivated rice cultivars (O. sativa L.) [1,2]. During the process of long-term domestication, many traits of cultivated rice have already been missed by artificial and natural selection. The relatively complete genome of wild rice ensures its wider phenotypic diversity in various traits [3,4].
Grain morphology encompasses grain length (GL), grain width (GW), thousand-grain weight (TGW), which are key factors that affect directly rice yield and quality [5]. The study of wild rice traits, especially grain characteristics, is promising for further improvement of the yield and quality of cultivated rice [6]. To date, more than four genes linked to grain shape have been cloned in rice [7,8,9]. GW2, the first major quantitative traits loci (QTL) isolated through map-based cloning, controls the width and weight of rice grains [10]. Similarly, the GS3 locus controls GL, TGW, GW, and grain plumpness [9], while GW8/OsSPL16 and GW7/OsSPL16 are determinants of GW and grain quality [7,8]. Finally, the GW5 gene has been associated with greater seed vigor and grain yield [11]. The temporary mapping populations such as F2 and F2:3 populations are sometimes limited by their chaotic genome background and smaller progeny quantity [12], which can only be used for the preliminary characterization and chromosome location of simple phenotypic traits to a large extent [13,14]. With the gradual improvement of plant genetics and genomics research, permanent mapping populations have overcome the shortcomings of temporary populations. Chromosome segment substitution lines (CSSLs) consist of a set of consecutive and overlapping donor chromosome segments in a recipient’s genetic background [15]. They are similar to the near-isogenic lines (NILs) in terms of the ease of identifying new QTLs, since their removal of more genetic interference from the genetic background. Several QTLs have been fine-mapped or cloned based on the NILs in rice [16], and CSSLs have been recently used to clone the GL-controlling gene GL4 [17]. TGW is one of the major factors determining rice yield, but the molecular and genetic factors that determine rice grain weight is still unclear [18]. Identification and utilization of major QTLs associated with rice TGW are of great significance [19]. In recent years, breakthroughs in the advanced genome-wide association analysis (GWAS) methods promote the identification of several new candidate genes and alleles linked to TGW in rice [20]. The GSK2-LARGE1/OML4 pathway controlling TGW in rice has been discovered, which revealed that the TGW is determined by the interaction of many alleles and QTLs [21,22]. The GLWR is one of the main determinants of the rice grain shape. At present, several GLWR-related genes have been cloned from rice. For instance, the OsRA2 RNA interference plant showed an increased grain length-width ratio (GLWR) [23]. Compared with wild-type rice, the GLWR and TGW of OsGRF1 overexpression plants were higher than Osgrf1 [24]. Furthermore, some grain quality-related genes have been cloned from common wild rice. For instance, Bh4 was identified in the common wild rice line W1943 and controlled the black glume color [25]. Gh1 encodes chalcone isomerase, and its mutation results in the golden glume phenotype [26]. In addition, the reddish glume and internode gene Gh2, which encodes a cinnamyl alcohol dehydrogenase (CAD), is a key enzyme in plant secondary metabolism and lignin synthesis [27]. Pb (also known as Prp-b) and its complementary gene Pp (also known as Prp-a) are responsible for the purple seed coat [28]. Ra and Rb genes with basic helix-loop-helix (bHLH) structure and homology to Lc were isolated from the leaf cDNA library of a purple leaf rice variety. The leaf margin color (LMC) is a distinctive trait in wild rice compared to cultivated rice, and a potential phenotypic trait that can be used as a marker by rice breeders to screen hybrids [29,30].
The economic traits identified from wild rice such as the plant height (PH) are important plant architecture traits to improve rice yield and biomass [31]. Semi-dwarf (sd-1), a defective gibberellin 20-oxidase gene in the gibberellin (GA) synthesis pathway, generated semi-dwarf rice and set a new record of rice yield in Asia in the 1960s [32]. As a major semi-dwarf gene, sd-1 is still widely used in modern rice varieties [33]. SLR1 gene encodes a DELLA protein, which is a negative regulator in the process of gibberellin GA signal transduction. Its slr1 mutant shows weak stems and elongated basal internodes [34]. As a BR signal receptor, OsBRI1 is highly homologous with AtBRI1 gene in Arabidopsis. It regulates rice internode elongation mainly by controlling cell division and elongation [35]. Internode elongation in rice is mainly controlled by phytochromes, which can regulate the expression of the GA biosynthetic gene OsGA3ox2 affecting the elongation of rice internodes [36,37]. Rice cultivars of higher PH are economic and environmental-friendly in maintaining both plant production and animal husbandry in paddy fields [38,39,40]. Thus, many PH-related QTLs of rice have been already detected by researchers worldwide [41,42].
Aiming at improving the efficiency of novel QTLs detection and promoting the rice breeding practice, the DP15-CSSLs were constructed by multiple backcrossing, self-crossing, and marker-assisted selection (MAS) from the wild rice DP15 and 93-11 in this study [43]. The 255 pairs of molecular markers developed evenly distributed across 12 chromosomes were to establish a set of CSSLs of wild rice covering the whole DP15 genome. In addition, 20 grain-related QTLs, one PH-related QTL qPH1.1, and one LMC-related QTL qLMC6.1 were detected according to the DP15-CSSLs, which were promising for the identification of new QTLs/Genes. The dominant QTL locus qPH1.1 controlling higher PH was mapped and characterized based on DP15-CSSLs and will be meaningful to explain the formation mechanism of higher PH in wild rice. The qLMC6.1 associated with purple leaf margin of wild rice was located in a region of 370-kb on chromosome 6 by the DP15-CSSLs, and qLMC6.1 can also control the leaf sheath color (LSC), stigma color (SC), and apiculus color (AC) was characterized to explore the distribution of anthocyanin in putative tissues and cells. Taken together, the DP15-CSSLs are a repository of various traits of Guangxi common wild rice, which can be effectively used as the introgression lines of wild rice in generating improved hybrid rice cultivars and ideal genetic populations for QTLs/genes mapping [44].

2. Materials and Methods

2.1. Plant Materials

In the present study, one elite wild rice accession DP15 was screened to establish wild rice CSSLs from 2361 Guangxi common wild rice materials preserved in the nursery of State Key Laboratory for Conservation and Utilization of Subtropical Agro-Bioresources, Nanning, Guangxi Province, China (Figure 1 and Figure S1) [15]. As a representative Guangxi common wild rice accession, DP15 shows various plant traits that are significantly different from cultivated rice variety 93-11 (Figure 1 and Figure S1, and Table S1). DP15 was used as a donor parent and 93-11 receptor parent to develop DP15-CSSLs (Figure 1 and Figure S2, Tables S2 and S3). The DP15-CSSLs materials and its parental materials used for QTLs detection and mapping were grown during 2020 (from 20 November 2019 to 10 May 2020) in Sanya, China (109°14′12″ N, 18°08′49″ E), and 2021 (from 2 March 2021 to 10 July 2021) in Nanning, Guangxi Province, China (109°01′16″ N, 22°79′98″ E), respectively.

2.2. Development of the DP15-CSSLs

The DP15 and 93-11 were respectively used as the donor and recipient parents to develop a set of CSSLs [15]. The DP15-CSSSLs were constructed by MAS, backcrossing, phenotypic identification, and artificial selections, as described previously (Figure 1 and Figure S2, Tables S2 and S3) [43,44,45,46]. The F1 progeny derived from a cross between 93-11 and DP15 were then backcrossed with 93-11 to produce the BC1F1. The self-crossed progeny of BC2F1 were selected based on 255 polymorphic molecular markers evenly distributed across 12 chromosomes (Figure 1 and Figure S2, Tables S2 and S3). BC2F1 plants were then backcrossed with 93-11 to produce the BC3F1 progeny, and primary CSSLs were selected based on their genotypes by MAS, which were then self-crossed to obtain the BC4F1 generation. Candidate CSSLs were screened from these progenies to detect the residual donor segments, followed by the selection of BC5F1 lines. The latter were then backcrossed to generate the BC6F1 progeny. Finally, the overlapping substitution segments across different lines were also screened from the BC4F2, BC5F2, and BC6F2 progeny to obtain the definite CSSLs (Figure 2 and Figure S2, and Table S4).

2.3. The Methods of Phenotypic Characterization of DP15-CSSLs

The DP15-CSSLs and its parent lines were planted with a 20-cm plant-spacing and a 30 cm row-spacing in the experimental field. Three randomly selected biological replicates of each DP15-CSSLs line were statistically measured for the values of various traits. The phenotypic characteristics of the DP15-CSSLs mature plants, including grain number (GN), TGW, GL, GW, GLWR, PH, LMC, AC, and LSC, were recorded under natural conditions in the experimental field during 2020 (from 20 November 2019 to 10 May 2020) in Sanya, China, and 2021 (from 2 March 2021 to 10 July 2021) in Nanning, Guangxi Province, China, respectively (Figure 3, Figures S2 and S3, and Table S5). When the seeds were matured under natural conditions, the dry seeds of each line were selected to measure the values of grain traits as previously described [47]. The tissue slices were processed by the frozen section machine Hestion CM2850. The vascular bundle scanning pictures were captured by a scanning electron microscope SEM refers to previous research [48]. The cell pictures were obtained by paraffin section with a phloroglucinol staining according to established protocols [49]. The anthocyanin fluorescence images of rice stigma protoplasts were captured by the confocal microscope (Leica-TCS-SP8MP) in reference to previous experimental methods [50].

2.4. Whole Genome Re-Sequencing (WGRS) and Bioinformatic Analysis of Genomic SSR, InDel, and SNP Markers

The genomic DNA of DP15 and 93-11 were extracted using a kit (Rapid Plant Genomic DNA Isolation Kit, Sangon Biotech). The SSR markers used in this research were referenced to the SSR database of rice (https://archive.gramene.org/db/markers; accessed on 15 November 2016) (Tables S2 and S3). The whole genome re-sequencing (WGRS) was performed on an Illumina HiSeq2500™ by Novogene Company (Beijing, China) refers to the standard Illumina protocol (Figures S5 and S6, and Table S6) [51]. The FASTQ files were processed by the software of FASTQ version 0.6.0 to access the read quality (https://github.com/OpenGene/fastp; accessed on 3 June 2019). The WGRS data were then compared to design the whole genome SNP (Single nucleotide polymorphism) markers and InDel (Insertion-deletion) markers according to the website of BWA version 0.7.16 (http://bio-bwa.sourceforge.net/; accessed on 4 August 2019) (Figures S7 and S8). Polymorphic genomic sites were evenly selected and designed for InDel markers (Figures S7 and S8, and Table S7). The Polymorphic regions (≥1 bp variation) with high sequencing depth (DP15 ≥ 50 fold) were selected to design the SNP and InDel markers [52]. The circos software online was also used to visualize the SNPs and InDels (http://www.circos.ca/software/download/circos/; accessed on 6 August 2019). The primers were designed by the online software Primer3 version 0.4.0 tools (https://bioinfo.ut.ee/primer3-0.4.0/; accessed on 7 August 2019). The PCR product size was designed with a range from 200 to 500 bp (Figure S8, Tables S1–S3 and S7).

2.5. Genomic DNA Extraction and PCR Amplification

Genomic DNA of DP15-CSSLs was extracted using a modified version of the CTAB method [53], and amplified by PCR according to established protocols [54]. The PCR products were separated in 7% polyacrylamide denaturing gels, and the bands were visualized using the silver-staining method and genotyped as previously described (Figure S9) [55].

2.6. QTL Mapping and Data Analysis

The substituted segments in DP15-CSSLs were screened as described previously [15]. The DP15-CSSLs genomes were visualized graphically using the Graphical Geno-Types32 software (GGT32), and putative QTLs were identified based on the significance level of p ≤ 0.001. If several CSSLs with overlapping substituted segments exhibit similar phenotypes, the relevant QTL is likely localized to an inter-genomic interval (Figure 2 and Figure S10, and Table S4) [56]. Based on the SNP markers located in target regions of QTLs, a BSA (Bulk segregation analysis) method based on GSR40K gene chip technology is used for fine mapping and verification of target QTLs [57]. The QTL nomenclature was followed as the previously described method [58], and the linkage map of QTLs was constructed using the Map-Chart 2.2 software [59]. The phenotypes and genotypes of the CSSLs were finally evaluated by the QTL Ici-Mapping 4.1.0 software, and the QTLs were mapped by a permutation test (Permutations = 1000, p = 0.05) [60]. The additive effect of a QTL was calculated as (Phenotypic value of CSSLs—phenotypic value of 93-11)/2, and the phenotypic contribution ratio of the additive effect was calculated as (Additive effect value/phenotypic value of 93-11) × 100 (Figure 2, Figure 3, Figures S10 and S11, and Table S4).

3. Results

3.1. Whole Genome Re-Sequencing (WGRS) of the Parental Materials

The parental material DP15 and 93-11 were re-sequenced by Illumina high-throughput sequencing technology by Novogene Company (Beijing, China), and the resultant genome sequence data were then mapped by the IRGSP-1.0 software. These high-quality sequencing data of 9.68 G and 9.8 G were obtained from DP15 and 93-11 genome re-sequencing with average sequencing depths of 19.37× and 20.45×, respectively (Table S6). The numbers of mapped reads between DP15 and 93-11 genome were 52,922,056 and 50,987,541, respectively (Figures S5 and S6). The GC content of mapped reads between DP15 and 93-11 was 45.3% and 44.2% (Table S6). The SNPs between DP15 and 93-11 genome are mainly mapped to the coding regions (CDS) and the 5′, 3′ untranslated regions (5′, 3′ UTR) with a total percentage of 95.11% to the whole genome variation (Figures S5 and S6). Compared to the Nipponbare reference genome, the numbers of SNPs in the DP15 and 93-11 genomes were 1,894,103 and 690,409, respectively (Figure S7 and Table S6).

3.2. Selection of Polymorphic Markers between DP15 and 93-11 Genome

The average genome SNPs density of DP15 and 93-11 were 0.51634603% and 0.182119873%, respectively. The frequency distribution and density of polymorphic genome SNPs and InDels between DP15 and 93-11 were detected, respectively. Based on the comparative analysis of the whole genome re-sequencing data of the parent materials DP15 and 93-11, 15,691 polymorphic InDel loci were detected between the two parental genomes. Among them, 12,565 mapped InDels were designed for polymorphic molecular markers by online bioinformatic software Primer3-0.4.0 (https://bioinfo.ut.ee/primer3-0.4.0/; accessed on 7 August 2019). The melting temperatures of the InDels were 55.02~61.24 °C, the GC content was 26.9~72.2%, and the average product lengths of the InDel markers were from 100 bp to 500 bp (Figures S7 and S8, and Table S1). Combining the InDel primers with the 2261 pairs of rice genomic SSR primers available in the laboratory, a total of 255 pairs of polymorphic markers with an average distance of 1.47 Mb were developed (Figure S8; Tables S1, S6, and S7). The representative electropherogram showed that there are polymorphic bands amplified with these developed InDels and SSR markers (Figure S9).

3.3. Chromosome Substitution Segments Analysis of DP15-CSSLs

In total, 255 pairs of genomic molecular markers have been developed with an average distance of about 1.47 Mb between two adjacent markers to establish these DP15-CSSLs (Tables S2 and S3). In this study, 59 CSSLs harboring targeted DP15 chromosomal segments in the 93-11 genetic background were finally established. The estimated length of the substituted chromosome segments in DP15-CSSLs ranged from 1.1 Mb to 15.9 Mb with an average length of 7.5 Mb. The cumulative coverage length of DP15-CSSLs segments is 344.34 Mb. Most of the complete genomes in each chromosome were covered by the DP15-CSSLs except for chromosomes 1 (80.37%), 2 (92.89%), 3 (82.14%), 4 (89.63%), 5 (92%), 7 (88.56%), 9 (92.75%), and 12 (97.14%). The total coverage rate of substituted segments in a genome was 91.72%, the average coverage rate of substitution segments in a chromosome was 92.96%, and the highest and lowest coverage was seen with chromosomes 6 (100%) and 1 (80.37%), respectively (Figure 2 and Figure S10, Tables S3 and S4).

3.4. Characteristics of Four Grain Related Traits of the DP15-CSSLs

The phenotypic variations between the parent lines and DP15-CSSLs were recorded, respectively, in Sanya and Naning during 2020 and 2021. The phenotypic values on four grain traits GL, GW, TGW, and GLWR were statistically analyzed, and the results showed that the phenotypic values collected from the two experimental sites over two years were consistent except for slight variation. The phenotypic values of GL, GW, TGW, and GLWR in DP15-CSSLs and its parents showed an extensive variation, which implied that there might be potential QTLs to be identified (Figure 3 and Figure S11, Tables S5 and S8). Compared to their two parents, these DP15-CSSLs showed a higher GLWR over the two years, which will also lay a foundation for the mapping of novel QTLs and the breeding of new cultivars. In addition, DP15-CSSLs showed a higher GL and GW in Sanya during 2020 than in Nanning during 2021, which may be affected by the environmental and ecological conditions. Based on the phenotypic values recorded, QTLs analysis on DP15-CSSLs ware carried out for the four grain traits TGW, GL, GW, and GLWR, about 20 QTLs were finally detected with linked molecular markers in the DP15-CSSLs (Figure 3, Figure 4, Figures S10, and S11, Tables S5 and S8).

3.5. Identification and Detection of TGW-Related QTLs of DP15-CSSLs

Combing the genotypes and TGW phenotype of DP15-CSSLs, QTLs related to TGW were screened in this research (Figure 3a, Figure 4a, and Figure S11, Tables S5 and S8). Most of the TGW in DP15-CSSLs were significantly less than that of 93-11 over the two years of 2020 and 2021 (Table S5). Seven QTLs (qTGW1.1, qTGW3.1, qTGW4.1, qTGW10.1, qTGW11.1, qTGW11.2, and qTGW12.1) related to TGW were identified with linked molecular markers on Chromosome 1, 3, 4, 10, 11, and 12, respectively (Figure 4a and Figure S11, and Table S8). Furthermore, qTGW1.1 showed a linkage with a molecular marker DXB-1-3 in chromosome one. The qTGW3.1 was identified in the overlapped substitution segments of ZN15, and ZN16 between the SSR marker RM517 and RM251, where the previously cloned gene LPA1 is also located [61]. The qTGW4.1 was mapped between RM1018 and RM3288. Likewise, qTGW10.1 was identified in the overlapping segment DP15-CSSLs of ZN49, and ZN50 within the RM6404 to RM216 region (Figure 4a and Figure S11, and Table S8). There are two QTLs related to TGW were detected in chromosome 11, named qTGW11.1 and qTGW11.2. The qTGW12.1 detected in chromosome 12 was located in an overlapping segment of ZN57 and ZN58 near the simple sequence repeat (SSR) marker RM313. The phenotypic contribution ratios of the seven TGW-related QTLs ranged from 7.96~11.11% in 2020 and 9.24~12.61% in 2021 (Figure 3a, Figure 4a, and Figure S11, and Table S8).

3.6. Identification and Detection of GL-Related QTLs of DP15-CSSLs

Some of the DP15-CSSLs showed shorter GL than 93-11 over two years (Figure 3b and Table S5). Five effective QTLs (qGL1.1, qGL2.1, qGL3.1, qGL5.1, and qGL6.1) related to GL were respectively identified on Chromosome 1, 2, 3, 5, and 6 (Figure 4b and Figure S11, Table S8). The qGL1.1 were linked to the over lapping segment of ZN4 and ZN5. The qGL2.1 was located at an interval between RM6842 and RM12355. The qGL3.1 in the DP15-CSSLs of ZN18 is linked with the marker RM1164. The qGL5.1 was identified as co-segregated with the RM1200 in the overlapping segment of ZN18 and ZN27. Finally, qGL6.1 was identified in the ZN35 substituted region between RM6071 and RM400 (Figure S11 and Table S8). The CP values of qGL3.1, qGL5.1, and qGL6.1 ranged from 11.52% to 6.5% in 2020 and from 11.94% to 6.5% in 2021 (Figure 4b and Figure S11, Table S8).

3.7. Identification and Detection of GW-Related QTLs of DP15-CSSLs

The GW of five DP15-CSSLs (ZN6, ZN35, ZN39, ZN40, ZN46, and ZN51) were significantly different from that of 93-11(Figure 3c, and Tables S5 and S9). Five QTLs (qGW1.1, qGW6.1, qGW7.1, qGW9.1, and qGW11.1) related to GW were identified that were distributed on Chromosome 1, 6, 7, 9, and 11, respectively. While qGW1.1 was identified between RM10159 and RM486, qGW6.1 was located between RM6071 to RM400, where the previously cloned gene DSG1 is also located [62]. In addition, qGW7.1 was in the substituted segments of ZN39 and near RM429, qGW9.1 was mapped to a substituted region of ZN46 between RM257 and RM245, and qGW11.1 in ZN51 between RM167 and RM120 (Figure 4c and Figure S11, and Table S8). The CP values ranged from 7.96% to 6.89% in 2020 and from 6.35% to 5.37% in 2021 (Table S8).

3.8. Identification and Detection of GLWR-Related QTLs of DP15-CSSLs

The GLWR of three CSSLs (ZN6, ZN40, and ZN43) was larger than that of 93-11 in 2020 (Figure 3d, Tables S5 and S8). Three QTLs (qGLWR1.1, qGlWR7.1, and qGLWR8.1) related to GLWR were identified, of which qGLWR1.1 was located in the segment of ZN6 between RM297 and RM486. The average CP value of qGLWR1.1 was 7.9% in 2020 and 8.15% in 2021 (Table S8). In addition, qGlWR7.1 was located near RM429, and its CP values were 8.51% in 2020 and 8.77% in 2021 (Figure 4d and Figure S11, and Table S8). Finally, qGLWR8.1 was located in the overlapping segment of ZN43 and ZN53 between RM344 and RM5663, and its mean CP values in 2020 and 2021 were 11.55% and 11.69%, respectively (Table S8).

3.9. Identification and Genetic Mapping of the qPH1.1

3.9.1. Characterization of the PH of a DP15-CSSL Line

ZN6 is a homozygous DP15-CSSL line, the chromosomal substitution segments of ZN6 were located on chromosome 1. The internode length of ZN6 and 93-11 were statistically counted at the maturation stage. The typical phenotype of ZN6 is a higher stem, and its PH is significantly higher than that of its recipient parent 93-11. Through the comparison of phenotypic values between ZN6 and 93-11 on the internode traits, the results showed that both the length and diameter of the first, second, third, and fourth internode of the substitution line ZN6 significantly increased compared with the donor parent 93-11 except for the panicle length (Figure 5 and Table S9). It can be inferred that the QTL controlling the longer stem of wild rice is located between two pairs of primers RM5 and DXB-1-7 on rice chromosome 1 (Figure 1 and Figure 5, and Table S9).

3.9.2. Characterization of the Cell Morphology in Culm

The length of rice stem is mainly determined by two main factors: cell length and cell numbers in unit area [63]. Therefore, the internodes of ZN6 and 9311 at the grain-filling stage were selected for tissue section analysis respectively. The results of the cell section showed that there was no significant difference in cell size between ZN6 and the recipient parent 93-11, but the cell density per unit area of ZN6 was significantly larger than that of the donor parent 93-11. This result preliminarily shows that the cell density per unit area of ZN6 was increased by genes that regulate the course of cell division, which finally promotes a higher PH and a thickening stem phenotype (Figure 6 and Table S10).

3.9.3. Genetic Analysis and Mapping of the qPH1.1

Through the genome background analysis of the ZN6, it can be inferred that the QTL controlling the higher stem of wild rice is located between two pairs of primers RM5~DXB-1-4 on rice chromosome 1 (Figure 7 and Table S2). For precise identification and mapping of the qPH1.1 controlling long culm in ZN6, a secondary genetic population was constructed by the backcross between ZN6 and recipient parent 93-11. The phenotype and genotype of each individual in the secondary F1 and F2 population were statistically recorded for the genetic mapping and fine mapping for the qPH1.1. The results showed that all the individuals in the F1 generation exhibited a higher PH phenotype, and the PH phenotype in the F2 population was obviously separated, then the phenotype data of the F2 population were calculated for genetic analysis (Table S11). Almost 82 of the 106 F2 plants exhibited long culm phenotype, and 24 plants showed short culm phenotype, which was consistent with the Mendelian 3:1 segregation ratio (χ2 = 0.101 ≤ χ2 0.05,1 = 3.84) (Table S11). Thus, qPH1.1 is likely encoded by a single dominant QTL. qPH1.1 was further located in an overlapping segment between SNP marker R0130491732 (30.49 Mb) and F0138403159 (40.41 Mb) by a BSA method with 40K SNP microarrays Chips (Figure 7a and Table S2). Based on the results of high-throughput sequencing, seven pairs of polymorphic molecular markers identified from the 12,565 mapped InDels were selected to do a fine mapping (Tables S1, S2, and S12). The genotypes and phenotypes of the F2 population were identified, which confirmed that qPH1.1 was located in the 4.3-Mb region between RM11782 and RM11983, with a LOD value of 9.56, a PVE value of 79.9% (Figure 7b,c, Tables S1 and S12).

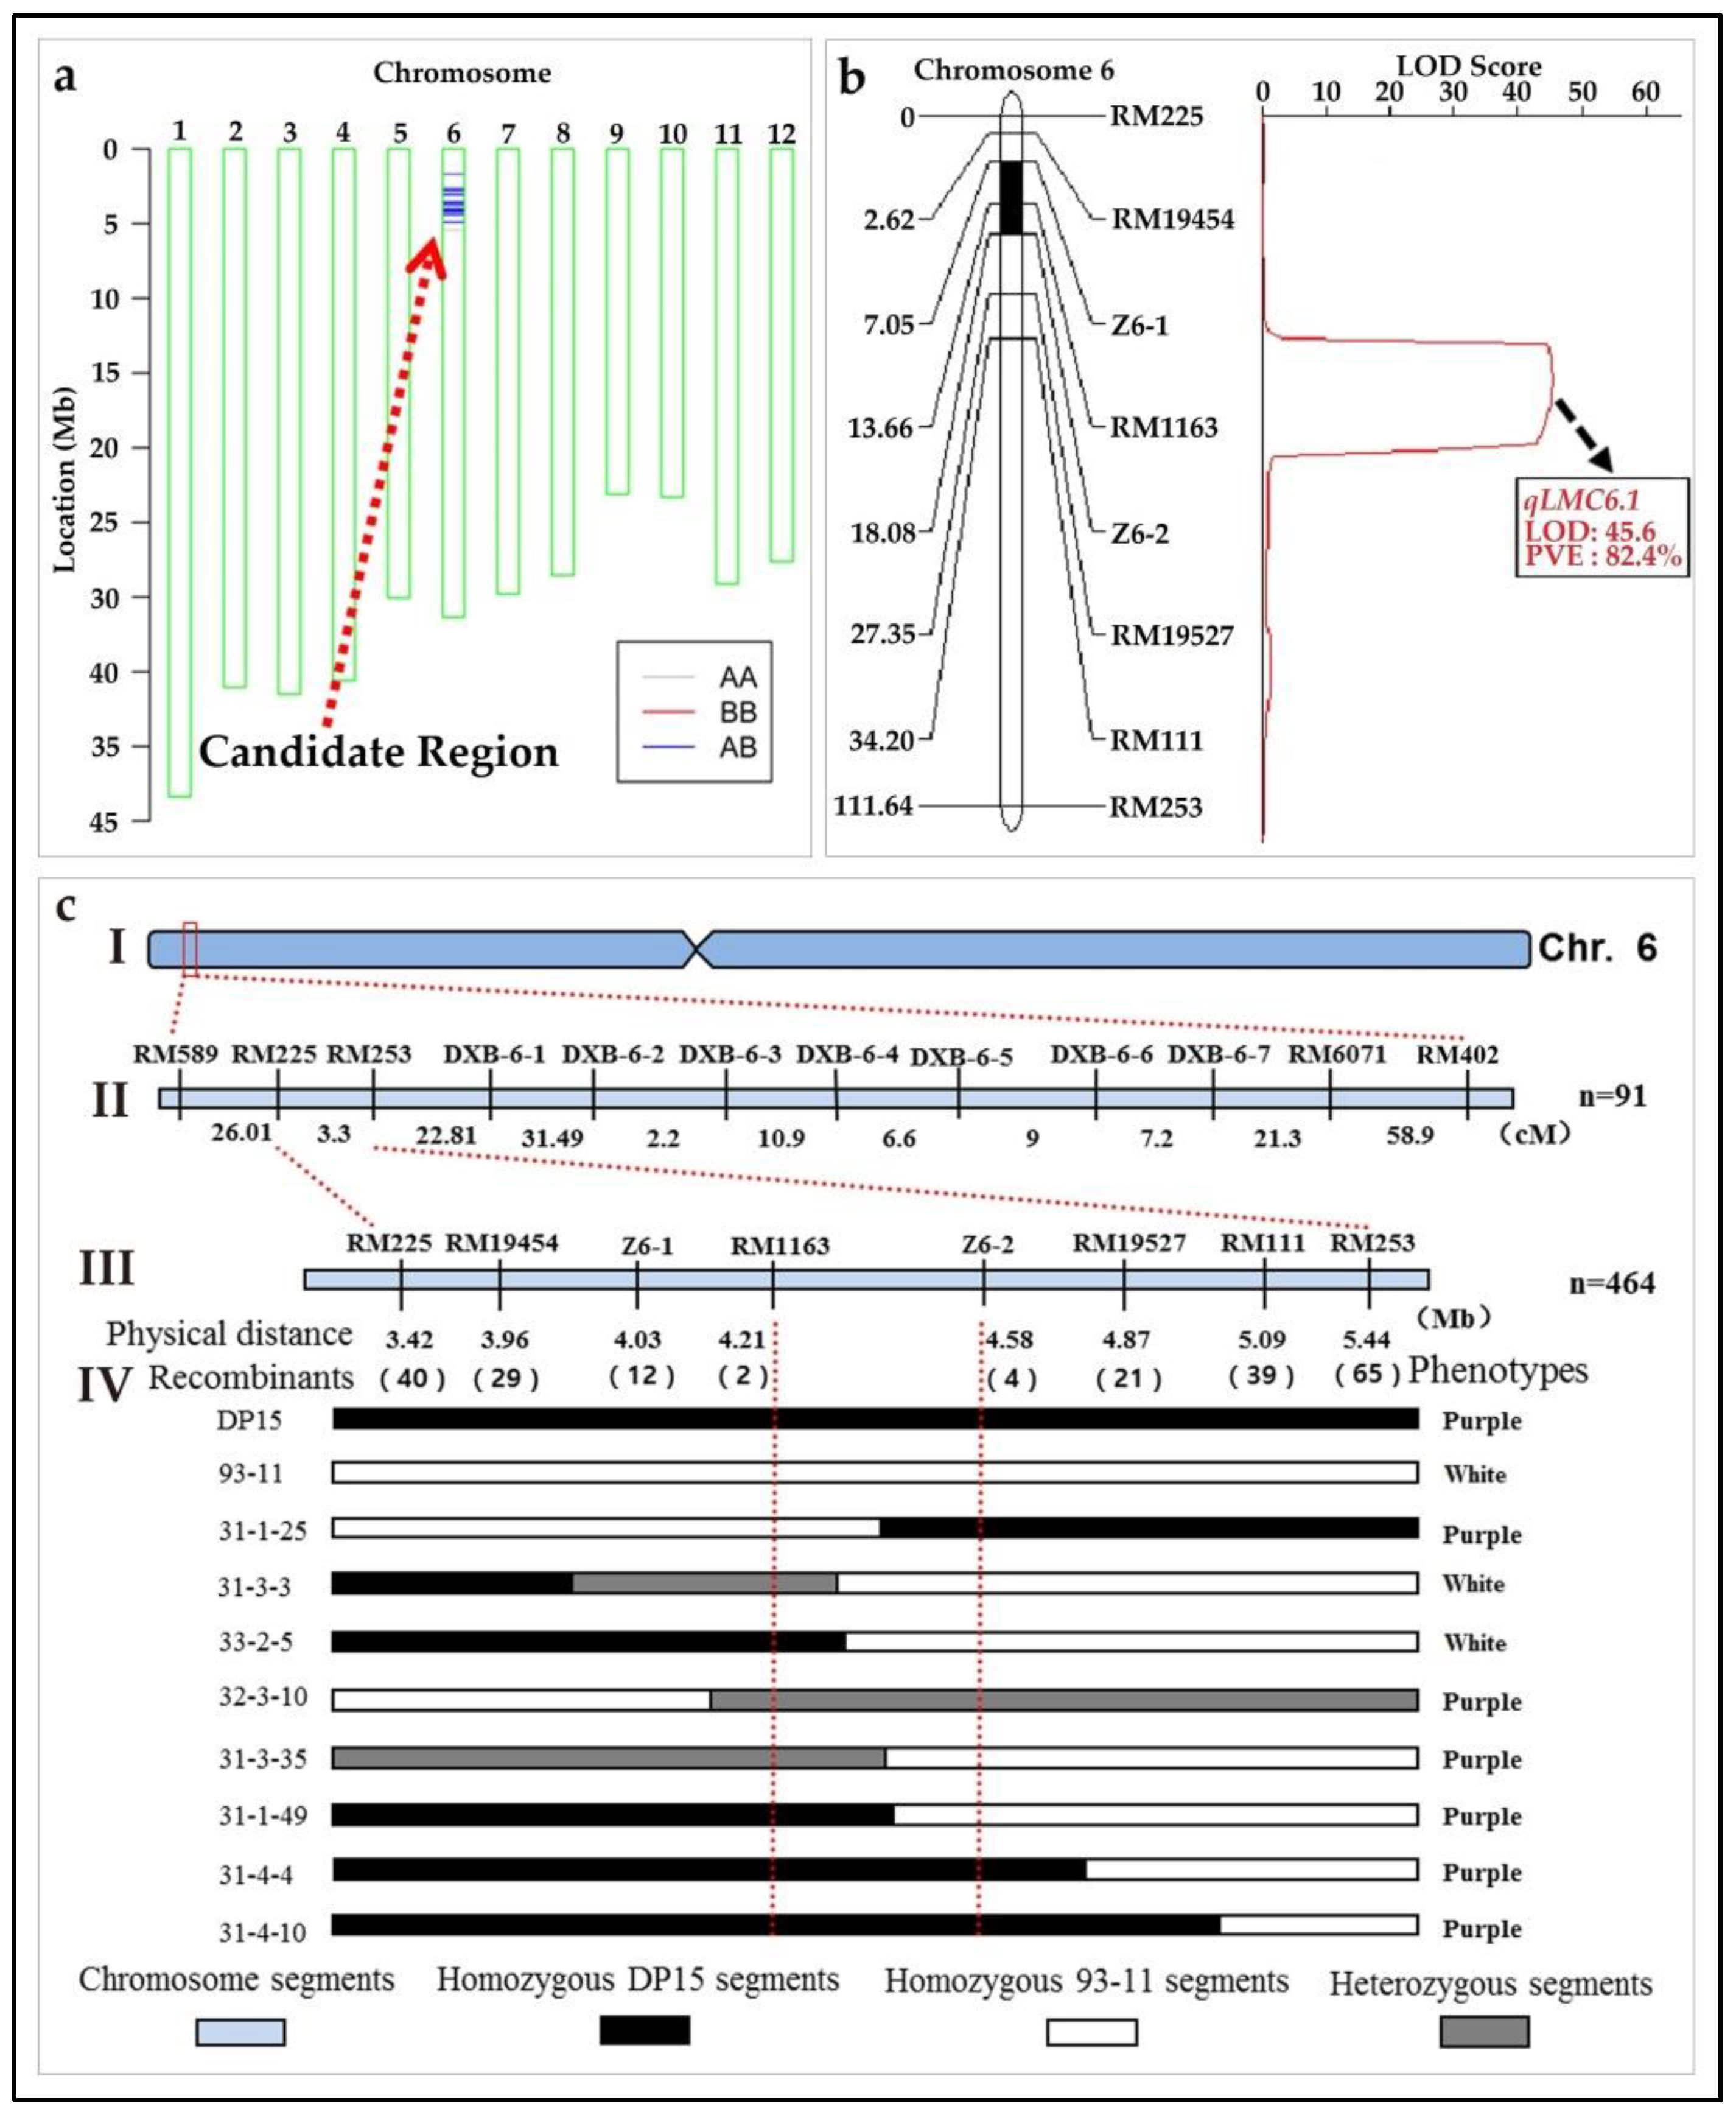
3.10. Identification and Genetic Mapping of the qLMC6.1

3.10.1. Characterization of the LMC of a DP15 CSSLs Line

ZN32 is a homozygous DP15-CSSL line that contains DP15 substitution fragments in chromosome 6. ZN32 shows a purple leaf margin phenotype that is significantly different from 93-11 (Figure 8 and Figure S11). Besides the LMC, the phenotypes related to plant architecture, leaf sheath, culm, auricle, apiculus, stigma, and basal shoot were identified. The results showed that there are significant differences between ZN32 and the recipient parent 93-11 among the color of the leaf margin, basal shoot, pillar, auricle, apiculus, stigma, and so on (Figure 8 and Figure S11). These results show that the differences between ZN32 and 93-11 are significant and stable, which implies that there is a gene controlling LMC located in chromosome 6 (Figure 2 and Figure S11, and Table S4).

3.10.2. Characterization of the Cell Morphology in Stigma Cell

To investigate the distribution of anthocyanin that can generate the differentially expressed cell morphology between ZN32 and 93-11. The stigma protoplast of ZN32 and 93-11 were extracted and evaluated by confocal microscopy according to previously reported research [50]. The vacuole in ZN32 showed significant reddish fluorescence coloration but no fluorescence signals were found in the nucleus, while no fluorescence signals were detected in the full cell in 93-11 (Figure 9). The results showed that anthocyanin, which is a kind of water-soluble pigment, was mainly distributed in the vacuole of the plant cell, which leads to the purple leaf margin phenotype in rice. In conclusion, this gene-controlling LMC is related to the synthesis of anthocyanin. It can be expressed specifically in some putative tissues, such as leaf margin, leaf sheath, stigma, apiculus, and so on (Figure 8 and Figure 9).

3.10.3. Genetic Analysis and Mapping of the qLMC6.1

The chromosome segment substitution line ZN32, a homozygous CSSL with a purple leaf margin, is significantly different from that of the recipient parent 93-11. Through the genome background analysis of ZN32, it can be inferred that the gene locus qLMC6.1 controlling the LMC is located in the interval of RM19381~DXB-6-4 on chromosome 6 (Table S15). The qLMC6.1 was further mapped to the RM225~DXB-6-1 region by analyzing the substitution fragments of the adjacent substitution lines ZN31 and ZN33 that were consistent with its phenotypes (Figure 10). The secondary mapping population was constructed by backcrossing the substitution line ZN32 with the recipient parent 93-11. The results showed that the LMC of all the F1 generation was purple, while the LMC phenotypes in the F2 population were obviously separated. The phenotype data of the F2 population were recorded and analyzed by a Chi-square test (Table S13). The results showed that among the total 91 plants of the F2 population, 66 individuals showed purple leaf margin phenotype and 29 showed white leaf margin phenotype, which was consistent with the Mendel 3:1 segregation ratio (χ2 = 0.18 ≤ χ2 0.05,1 = 3.84) (Table S13). Therefore, qLMC6.1 may be encoded by a single locus. Through the 40K SNP microarray chip BSA method, qLMC6.1 was further located in the overlapping fragments between the SNP molecular markers R0601663377 (1.66 Mb) and R0605432762TC (5.43 Mb) (Figure 10a, Tables S14 and S15). Through genetic linkage analysis of a secondary F2 population of 93-11/ZN32 by 12 SSR markers of Chromosome 6, qLMC6.1 was initially mapped to the region of RM225~RM253 on the short arm of chromosome 6. The two linked markers, RM225 and RM253, were then used to screen recombinants of heterozygous type in the segregation populations of F2, the selected heterozygous recombinants ware subsequently self-crossing to obtain F3 segregation populations. Based on the results of high-throughput sequencing, six new polymorphic InDel markers between RM225 and RM253 were developed to conduct a fine mapping of qLMC6.1. Through the identification and analysis of the genotype and phenotype of 464 individuals of the F3 segregation population, it is confirmed that qLMC6.1 is located in the 370 Kb region between marker RM1163 and Z6-2, with a LOD value of 45.6 and a PVE value of 82.4% (Figure 10b,c and Table S15).

4. Discussion

As one of the earliest domesticated cereal crops, rice feeds half of the world’s population. During the long-term domestication and natural selection, the presently cultivated rice showed remarkable morphological changes compared to common wild rice in evolution [64]. Through long-term artificial and natural selection in history, various genes of the cultivated rice have already been missed during the domestication courses, the relatively complete genome of wild rice ensures its wider phenotypic diversity in various traits. Although several novel QTLs were identified using CSSLs/SSSLs of cultivated rice [65,66,67], few wild rice CSSLs/SSSLs were developed for the mining of new genes [68,69]. Located in the subtropical zone, Guangxi is rich in wild rice resources [70,71]. Rice domestication through artificial and natural selection led to the reduction of several important agronomic traits that can be found in wild rice. Based on the extensive germplasm resources of Guangxi, a typical common wild rice accession DP15 with several important economic traits was identified and selected to develop a set of CSSLs (Figure S1). Our investigation revealed the significant phenotypic difference in various morphological traits observed between DP15 and the indica rice variety 93-11, including PH, awn length, leaf width, LMC, tiller number, tiller angle, spreading panicle, seed color, seed shattering, seed dormancy, GN, GL, GW, TGW, GLWR, and so on [72]. Through the WGRS, the genomic differences were highlighted by the bioinformatic analysis in this study, and 12,565 pairs of polymorphic InDel markers were designed to establish DP15-CSSLs and mining for novel genome QTLs. Both the extensive phenotypic and genetic variation make this DP15-CSSL a natural gene pool that can be utilized to identify new QTLs and generate rice cultivars with advantageous traits. As is known, CSSLs consist of a set of consecutive and overlapping donor chromosome segments in a recipient genetic background, which is an ideal genetic population for the mapping of QTLs [73,74]. In this study, 59 CSSLs from the common wild rice (O. rufipogon Griff.) accession DP15 under indica rice cultivar (O. sativa L. ssp. indica) variety 93-11 backgrounds were constructed through whole genome re-sequencing, multiple backcrosses, self-crossing, and MAS. The total genome substitution segment length of this DP15-CSSLs library was 344.34 Mb, and the average coverage rate of substitution segments in the chromosome was 91.72%. The genome coverage rate of the DP15-CSSLs can be increased with the expanded screening of CSSLs from the progeny of BC4F2, BC5F2, and BC6F2 progeny. In contrast to previous research on CSSLs, the DP15-CSSLs showed a higher coverage rate, which was mainly defined by the density and amounts of polymorphic molecular markers [75,76]. Moreover, our DP15-CSSLs library was constructed under the indica rice background, which will be complementary to the wild rice CSSLs research [77]. In recent years, several genes controlling the resistance to both biological stress and abiotic stress have been identified [78,79,80]. However, novel genes related to agronomy traits such as grain appearance, leaf color, and PH remain to be exploited. The molecular mechanisms of how these traits function are still largely unknown.
Besides the significant difference in phenotype, there are a large number of genomic variations between common wild rice and cultivated rice, which is of great convenience for the detection of QTLs. Parental materials that show phenotypic variation in the target traits due to variations in the genome are necessary for genetic QTL mapping [81]. With the rapid development in the technology of bioinformatic analysis and genome sequencing, extensive genomic SNPs and InDels can be well detected and applied to gene mapping and prediction. SSSLs/CSSLs with both higher genetic and phenotypic differences are effective tools for fine mapping, cloning, and analysis of novel QTLs [82,83]. CSSLs/SSSLs have previously promoted the identification of novel QTLs related to grain traits in Yuanjiang common wild rice species [84,85,86]. A set of SSSLs harboring the C563~C63 region encoding for long stigma was identified from Nipponbare/Kasalath-SSSLs and a secondary F2 population of SSSL14/Nipponbare was successfully used to fine-map the qSTL3, which identified LOC_Os03g14850, LOC_Os03g14860, and LOC_Os03g14880 as the candidate genes controlling stigma length [87]. The study of wild rice traits, especially grain-related traits, is promising for further improvements in the yield and quality of cultivated rice [83]. Agronomy traits such as the GL, GW, and TGW are the major determinant of yield potential [88]. Through the phenotype screening of DP15-CSSLs, four-grain traits including GL, GW, TGW, and GLWR that are significantly different from 93-11 were selected for the detection, of novel QTLs. To decrease the influence of variation in the phenotypic values for QTLs detection, these four traits were recorded in different experiment fields over two years [89]. Thus, a total number of 20 QTLs were detected. Among them, seven QTLs controlling TGW were detected by the whole genome screening, of which qTGW3.1 is near the gene LPA1 (LOC_Os03g13400), which encodes a plant-specific transcriptional inhibitor associated with shorter grains and decreased TGW, the other QTLs are new QTLs without any previous report [82]. Based on the genotype and phenotypic values of these DP15-CSSLs on GL, five QTLs on GL were identified. The GL that often shows a positive correlation with GLWR is an important agronomy trait for grain appearance [90]. The qGL3.1 detected in this research is near the long kernel controlling gene OsGS3, and OsGS3 is the main factor controlling rice GL and TGW [91]. But the other four QTLs of GL are distributed in new regions according to the previously reported QTLs on GL [92]. Five QTLs related to GW were also detected by the whole genome screening, of which the qGW6.1 detected in this DP15-CSSLs is near the previously cloned DSG1 (LOC_Os06g06090) gene, DSG1 belongs to the OsMAPK6 family and results in dwarfing, shorter internodes, erect leaves, smaller anthers and grains, and a significant decrease in GL, GW, and TGW [93,94]. In addition, Three QTLs related to GLWR were detected through the whole genome screening of QTLs in this DP15-CSSLs. The qGLWR7.1 detected in a region from RM6071 to RM400 was near the OsGL7 gene, GL7 encodes a LONGIFOLIA protein and results in an increased GLWR, larger and more dense starch granules [95]. However, the other two QTLs related to GLWR were novel QTLs according to previous studies [96]. The traits of grain morphology such as GL, and GW often show significant correlations with TGW in cereal crops. Interestingly, the QTLs qGL1.1 and qTGW1.1 were detected in a similar region that may be the same QTL. The qGLWR1.1 and qGW1.1 were detected in an overlapping region on chromosome 1, which may be affected by the significant correlations between GW and GLWR in cereal crops [97]. The qGLWR7.1 and qGW7.1 detected in chromosome 7 were linked to the same region near the RM429. Further experiments are being carried out for elucidation.
Besides the 20 QTLs related to grain traits, one dominant QTL qPH1.1 controlling the PH on chromosome 1 and one novel dominant QTL qLMC6.1 controlling LMC on chromosome 6 were detected. As the traits of long awn and shattering, higher PH and purple leaf margin are often typical characterizations of wild rice [98,99,100]. A homozygous long-culm DP15-CSSL line and a purple leaf margin DP15-CSSL line were selected to construct secondary genetic populations for the mapping of qPH1.1 and qLMC6.1. Based on the genotype and phenotypic values of the secondary populations, the qPH1.1 controlling higher PH was successfully validated and mapped to a region of 4.31 Mb and qLMC6.1 associated with purple leave margin was located in a region of 370 kb. The qPH1.1-containing plants showed a long culm phenotype with a significantly increased length on the internodes of rice. The genetic basis of PH can mainly be affected by cell elongation and cell density in the unit area of stem cells [101]. To verify the underlying mechanism in the generation of the longer internode, the frozen and paraffin section of rice culm were conducted to detect the cell morphology in stems. The results of this research showed that qPH1.1 can significantly promote cell proliferation in the stem to generate an increased PH. Our previous research revealed sd1 gene controlling the PH mainly by the increase in cell size and cell layers was nearly located in the same region on chromosome 1 with qPH1.1. However, qPH1.1 showed a higher PH than the sd1 mutants, which implied that qPH1.1 may be a novel allele controlling higher PH [102]. In terms of phenotype, the qPH1.1 detected from DP15-CSSLs is novel compared to these previously mapped QTLs of PH in rice [103]. The OsBRI1, which showed a close linkage with the RFLP marker C1370, was also located near this region [104]. The mutant plants of OsBRI1 showed a BR signal transduction inhibition, which caused the elongation limitation of specific internodes, the leaf angle decreased, the leaf blade was upright, and the leaf sheath was shorter than that of wild-type, the spike neck was longer than that of wild-type [105]. In contrast to OsBRI1, qPH1.1 showed no significant difference in leaf sheath, leaf angle, and longitudinal cell elongation, which implied that the BR signal transduction pathway showed less effect on qPH1.1 [106]. Our ongoing exploration of this qPH1.1 will focus on the gene regulatory network by gene prediction and RNA-sequencing, which may disclose the potential mechanism [107]. The stem diameter of ZN6 is significantly larger than 93-11, which makes the ZN6 higher biomass and is resistant to lodging to a certain extent. The long-culm DP15-CSSL line ZN6 of higher biomass will provide an economic material for the animal husbandry industry such as frog farming, crab aquaculture, duck, and livestock breeding [38,39,40,108]. Many biomass-related QTLs of rice have already been detected by researchers worldwide [41,42]. Anthocyanin is attractive for its innate coloring, antioxidant capacity, and biological potential in food additives and functional foodstuffs [109,110]. The mining of qLMC6.1 from wild rice will promote the exploration of the anthocyanin distribution in specific tissues. Up to now, several anthocyanin-related genes have already been cloned by researchers worldwide in plants [50,111]. Compared to the already mapped QTLs related to anthocyanin, the qLMC6.1 detected in this research is located near the OsC1 gene. The OsC1 is critical for anthocyanin production in rice [111,112,113]. The qLMC6.1 will be an important tool in selective breeding for pure varieties. To verify the underlying mechanism in the generation of the color, the stigma protoplast of ZN32 and 93-11 were isolated and evaluated by confocal microscopy to detect the distribution of anthocyanin in the plant cell. The results showed that anthocyanin which is a water-soluble pigment was mainly distributed in the vacuole of the plant cell may lead to the purple leaf margin phenotype in rice, which is consistent with previous studies [28,111]. The qLMC6.1 controlling LMC is related to the synthesis of anthocyanin and tissue-specific expressed specifically in some putative tissues, such as leaf margin, leaf sheath, stigma, apiculus, and so on (Figure 8 and Figure S11). Our ongoing experiment on qLMC6.1 will focus on gene prediction and cloning, the gene, and promoter of qLMC6.1 are promising to explain the underlying the mechanism of anthocyanin regulatory network (Figure S15). SSSLs/CSSLs of wild rice, which possess great potential for further exploitation and utilization, are good breeding materials for future rice breeding and improvement [15,82]. In all, these 22 QTLs identified from Guangxi common wild rice can potentially promote theoretical knowledge and genetic applications to rice breeders worldwide.

5. Conclusions

In this research, a set of 59 CSSLs covering 91.72% of the wild rice DP15 genome with the indica rice cultivar 93-11 backgrounds were constructed. Significant differences in four grain-related traits, PH, and LMC phenotypes between the Guangxi wild rice DP15 and the 93-11 were identified for the QTL detection in this research. About 20 QTLs associated with grain-related traits, one PH-controlling QTL, and one LMC-regulating QTL were detected. Furthermore, 12,565 mapped InDels were identified and designed for polymorphic molecular markers by high-throughput genome re-sequencing between wild rice accession DP15 and indica rice cultivar 93-11, which are well-identified and designed for polymorphic molecular markers. The PH-controlling QTL qPH1.1 and the LMC-regulating QTL qLMC6.1 were fine-mapped by the construction of two secondary genetic populations, which are of great significance for breeding and gene cloning. Thus, the DP15-CSSLs are a promising tool for novel gene discovery and rice breeding. Our ongoing experiments aim to investigate the grain-size-related QTLs in wild rice and clone the novel QTLs mapped in this research.

Supplementary Materials

The following supporting information can be downloaded at: https://www.mdpi.com/article/10.3390/biom12121850/s1, Figure S1: Nursery figures of 2361 common wild rice germplasm; Figure S2: Roadmap used to establish genetic population of DP15-CSSLs; Figure S3: Morphology of several typical grain traits in DP15-CSSLs; Figure S4: Phenotype of the purple leaf margin CSSL line ZN32; Figure S5: The chromosomal distribution of reads detected on the genome of DP15; Figure S6: The regional distribution of mapped reads detected on the DP15 genome; Figure S7: Frequency distribution circos of InDels and SNPs of DP15 and 93-11; Figure S8: Density and distribution diagram of polymorphic InDels markers between DP15 and 93-11 based on the WGRS; Figure S9: Representative polyacrylamide denaturing gels electrophoretogram obtained from DP15 and 93-11 amplified with the InDels and SSR markers; Figure S10: Distribution of substituted segments length in 59 DP15-CSSLs; Figure S11: Distribution of twenty QTLs for four different grain traits on 12 chromosomes; Table S1: Polymorphic InDel makers designed between DP15 and 93-11 re-sequenced genome; Table S2: Polymorphic molecular markers used for the construction of DP15-CSSLs; Table S3: Distribution and density of polymorphic molecular markers for the construction of DP15-CSSLs; Table S4: The distribution of chromosome substitution segments in 59 DP15-CSSLs; Table S5: Average statistics for four grain traits of 93-11 and the 59 DP15-CSSLs populations observed over two years; Table S6: Whole-genome re-sequencing analysis of DP15 and 93-11; Table S7: Distribution and density of SNPs identified between DP15 and 93-11; Table S8: QTLs related to four grain traits of DP15 detected with the linkaged markers based on the DP15-CSSLs; Table S9: Comparison of internode length in culms between ZN6 and 93-11; Table S10: Comparison of internode diameter in culms between ZN6 and 93-11; Table S11: Genetic segregation analysis of its F2 population for the plant height controlling QTL qPH1.1; Table S12: Polymorphic molecular markers for the mapping of qPH1.1; Table S13: Genetic segregation analysis of the F2 population for the leaf margin controlling QTL qLMC6.1; Table S14: Polymorphic molecular markers for the mapping of qLMC6.1; Table S15: Genes prediction in associated region of qLMC6.1 locus by genetic mapping.

Author Contributions

Conceptualization, N.Z., R.Y., B.U., J.Q. and R.L.; methodology, R.Y., B.U., J.Y., J.Y., J.Q., L.P., E.M. and R.L.; software, N.Z., R.Y. and R.L.; validation, N.Z., R.Y., F.L., B.Q. and R.L.; formal analysis, R.Y., B.U., J.Y., L.P., J.Q., E.M. and R.L.; investigation, N.Z., R.Y., B.U., J.Q. and R.L.; resources, N.Z., F.L., B.Q. and R.L.; data curation, N.Z., R.Y., B.U., J.Q., J.Y. and R.L.; writing—original draft preparation, N.Z., R.Y., B.U., F.L., J.Q., J.Y., L.P., E.M. and R.L.; writing—review and editing, N.Z., R.Y., B.U., F.L., E.M. and R.L.; visualization, N.Z., R.Y., B.U., J.Q. and R.L.; supervision, F.L., B.Q. and R.L.; project administration, F.L., B.Q. and R.L.; funding acquisition, R.L. All authors have read and agreed to the published version of the manuscript.

Funding

This research was funded by the Guangxi Zhuang Autonomous Region Science and Technology Development, grant numbers (Guike AA17204070, Guike AB16380066; Guike AB16380093).

Institutional Review Board Statement

Not applicable.

Informed Consent Statement

Not applicable.

Data Availability Statement

Raw data can be provided to researchers on request to corresponding or first author.

Acknowledgments

We would like to thank Yongfu Qiu and Jijing Luo for the helpful discussion and invaluable comments given to make this research meaningful.

Conflicts of Interest

The authors declare no conflict of interest.

Abbreviations

CTABHexadecyl Trimethyl Ammonium Bromide
PHPlant Height
GWGrain Width
GLGrain Length
GNGrain Number
TGWThousand-grain Weight
GLWRGrain Length-width Ratio
LMCLeaf Margin Color
ACApiculus Color
SCStigma Color
LSCLeaf Sheath Color
SSRSimple Sequence Repeats
SNPSingle Nucleotide Polymorphism
InDelInsertion-Deletion
RFLPRestriction Fragment Length Polymorphism
MASMarker-assisted Selection
PAGEPolyacrylamide Gel Electrophoresis
PCRPolymerase Chain Reaction
CSSLsChromosome Segment Substitution Lines
SSSLsSingle Segment Substitution Lines
NILsNear Iso-genic Lines
DHsDouble Haploid Lines
LODLogarithm of The Odds
PVEPhenotypic Variation Explained
QTLQuantitative Trait Locus
BSABulked Segregants Analysis Sequencing
Chr.Chromosome
RNA-seqRNA-Sequencing
WGRSWhole Genome Re-sequencing
GWAS Genome Wide Association Study
BSABulked Segregants Analysis
GA Gibberellin Acid
SEMScanning Electron Microscope
MAPKMitogen-activated protein kinase
bHLHBasic Helix-loop-helix Transcription Factor
UTRUntranslated Regions
CDSCoding DNA sequence
ncRNANon-coding RNA
CADCinnamyl Alcohol Dehydrogenase
MtMitochondrion
PtChloroplast

References

  1. Zhang, J.; Long, Y.; Xue, M.; Xiao, X.; Pei, X. Identification of microRNAs in Response to Drought in Common Wild Rice (Oryza rufipogon Griff.) Shoots and Roots. PLoS ONE 2017, 12, e0170330. [Google Scholar] [CrossRef] [PubMed] [Green Version]
  2. Lam, D.T.; Buu, B.C.; Lang, N.T.; Toriyama, K.; Nakamura, I.; Ishikawa, R. Genetic diversity among perennial wild rice Oryza rufipogon Griff., in the Mekong Delta. Ecol. Evol. 2019, 9, 2964–2977. [Google Scholar] [CrossRef] [Green Version]
  3. Baucom, R.S.; Estill, J.C.; Leebens-Mack, J.; Bennetzen, J.L. Natural selection on gene function drives the evolution of LTR retrotransposon families in the rice genome. Genome Res. 2009, 19, 243–255. [Google Scholar] [CrossRef] [PubMed] [Green Version]
  4. Vigueira, C.C.; Qi, X.; Song, B.K.; Li, L.F.; Caicedo, A.L.; Jia, Y.; Olsen, K.M. Call of the wild rice: Oryza rufipogon shapes weedy rice evolution in Southeast Asia. Evol. Appl. 2019, 12, 93–104. [Google Scholar] [CrossRef] [PubMed] [Green Version]
  5. Descalsota-Empleo, G.I.; Noraziyah, A.A.S.; Navea, I.P.; Chung, C.; Dwiyanti, M.S.; Labios, R.J.D.; Ikmal, A.M.; Juanillas, V.M.; Inabangan-Asilo, M.A.; Amparado, A.; et al. Genetic Dissection of Grain Nutritional Traits and Leaf Blight Resistance in Rice. Genes 2019, 10, 30. [Google Scholar] [CrossRef] [Green Version]
  6. Gouda, G.; Gupta, M.K.; Donde, R.; Mohapatra, T.; Vadde, R.; Behera, L. Marker-assisted selection for grain number and yield-related traits of rice (Oryza sativa L.). Physiol. Mol. Biol. Plants 2020, 26, 885–898. [Google Scholar] [CrossRef]
  7. Usman, B.; Nawaz, G.; Zhao, N.; Liao, S.; Qin, B.; Liu, F.; Liu, Y.; Li, R. Programmed Editing of Rice (Oryza sativa L.) OsSPL16 Gene Using CRISPR/Cas9 Improves Grain Yield by Modulating the Expression of Pyruvate Enzymes and Cell Cycle Proteins. Int. J. Mol. Sci. 2021, 22, 249. [Google Scholar] [CrossRef]
  8. Wang, S.; Wu, K.; Yuan, Q.; Liu, X.; Liu, Z.; Lin, X.; Zeng, R.; Zhu, H.; Dong, G.; Qian, Q.; et al. Control of grain size, shape and quality by OsSPL16 in rice. Nat. Genet. 2012, 44, 950–954. [Google Scholar] [CrossRef]
  9. Liu, L.; Zhou, Y.; Mao, F.; Gu, Y.; Tang, Z.; Xin, Y.; Liu, F.; Tang, T.; Gao, H.; Zhao, X. Fine-Tuning of the Grain Size by Alternative Splicing of GS3 in Rice. Rice 2022, 15, 4. [Google Scholar] [CrossRef]
  10. Tomita, M.; Yazawa, S.; Uenishi, Y. Identification of Rice Large Grain Gene GW2 by Whole-Genome Sequencing of a Large Grain-Isogenic Line Integrated with Japonica Native Gene and Its Linkage Relationship with the Co-integrated Semidwarf Gene d60 on Chromosome 2. Int. J. Mol. Sci. 2019, 20, 5442. [Google Scholar] [CrossRef]
  11. Qin, M.; Zhang, Y.; Yang, Y.; Miao, C.; Liu, S. Seed-Specific Overexpression of SPL12 and IPA1 Improves Seed Dormancy and Grain Size in Rice. Front. Plant Sci. 2020, 11, 532771. [Google Scholar] [CrossRef] [PubMed]
  12. Harushima, Y.; Yano, M.; Shomura, A.; Sato, M.; Shimano, T.; Kuboki, Y.; Yamamoto, T.; Lin, S.Y.; Antonio, B.; Parco, A.; et al. A high-density rice genetic linkage map with 2275 markers using a single F2 population. Genetics 1998, 148, 479–494. [Google Scholar] [CrossRef] [PubMed]
  13. Yan, J.; Wu, Y.; Li, W.; Qin, X.; Wang, Y.; Yue, B. Genetic mapping with testcrossing associations and F2:3 populations reveals the importance of heterosis in chilling tolerance at maize seedling stage. Sci. Rep. 2017, 7, 14336. [Google Scholar] [CrossRef] [PubMed] [Green Version]
  14. Kanyange, L.; Kamau, J.; Ombori, O.; Ndayiragije, A.; Muthini, M. Genotyping for Blast (Pyricularia oryzae) Resistance Genes in F2 Population of Supa Aromatic Rice (Oryza sativa L.). Int. J. Genom. 2019, 2019, 5246820. [Google Scholar] [CrossRef] [PubMed] [Green Version]
  15. Yuan, R.; Zhao, N.; Usman, B.; Luo, L.; Liao, S.; Qin, Y.; Nawaz, G.; Li, R. Development of Chromosome Segment Substitution Lines (CSSLs) Derived from Guangxi Wild Rice (Oryza rufipogon Griff.) under Rice (Oryza sativa L.) Background and the Identification of QTLs for Plant Architecture, Agronomic Traits and Cold Tolerance. Genes 2020, 11, 980. [Google Scholar] [CrossRef]
  16. Yang, W.J.; Nadolska-Orczyk, A.; Wood, K.V.; Hahn, D.T.; Rich, P.J.; Wood, A.J.; Saneoka, H.; Premachandra, G.S.; Bonham, C.C.; Rhodes, J.C.; et al. Near-isogenic lines of maize differing for glycinebetaine. Plant Physiol. 1995, 107, 621–630. [Google Scholar] [CrossRef] [Green Version]
  17. Wu, W.; Liu, X.; Wang, M.; Meyer, R.S.; Luo, X.; Ndjiondjop, M.; Tan, L.; Zhang, J.; Wu, J.; Cai, H.; et al. A single-nucleotide polymorphism causes smaller grain size and loss of seed shattering during African rice domestication. Nat. Plants 2017, 3, 17064. [Google Scholar] [CrossRef]
  18. Chen, K.; Łyskowski, A.; Jaremko, Ł.; Jaremko, M. Genetic and Molecular Factors Determining Grain Weight in Rice. Front. Plant Sci. 2021, 12, 605799. [Google Scholar] [CrossRef]
  19. Xu, F.; Sun, X.; Chen, Y.; Huang, Y.; Tong, C.; Bao, J. Rapid Identification of Major QTLs Associated with Rice Grain Weight and Their Utilization. PLoS ONE 2015, 10, e0122206. [Google Scholar] [CrossRef] [Green Version]
  20. Niu, Y.; Chen, T.; Wang, C.; Chen, K.; Shen, C.; Chen, H.; Zhu, S.; Wu, Z.; Zheng, T.; Zhang, F.; et al. Identification and allele mining of new candidate genes underlying rice grain weight and grain shape by genome-wide association study. BMC Genom. 2021, 22, 602. [Google Scholar] [CrossRef]
  21. Lyu, J.; Wang, D.; Duan, P.; Liu, Y.; Huang, K.; Zeng, D.; Zhang, L.; Dong, G.; Li, Y.; Xu, R.; et al. Control of Grain Size and Weight by the GSK2-LARGE1/OML4 Pathway in Rice. Plant Cell 2020, 32, 1905–1918. [Google Scholar] [CrossRef] [PubMed]
  22. Zeng, Y.; Shi, J.; Ji, Z.; Wen, Z.; Liang, Y.; Yang, C. Combination of twelve alleles at six quantitative trait loci determines grain weight in rice. PLoS ONE 2017, 12, e0181588. [Google Scholar] [CrossRef] [PubMed] [Green Version]
  23. Lu, H.; Dai, Z.; Li, L.; Wang, J.; Miao, X.; Shi, Z. OsRAMOSA2 Shapes Panicle Architecture through Regulating Pedicel Length. Front. Plant Sci. 2017, 8, 1538. [Google Scholar] [CrossRef] [PubMed] [Green Version]
  24. Yang, X.; Zhao, X.; Dai, Z.; Ma, F.; Miao, X.; Shi, Z. OsmiR396 growth regulating factor modulate rice grain size through direct regulation of embryo-specific miR408. Plant Physiol. 2021, 186, 519–533. [Google Scholar] [CrossRef]
  25. Zhu, B.; Si, L.; Wang, Z.; Zhu, Y.Z.J.; Shangguan, Y.; Lu, D.; Fan, D.; Li, C.; Lin, H.; Qian, Q.; et al. Genetic Control of a Transition from Black to Straw-White Seed Hull in Rice Domestication. Plant Physiol. 2011, 155, 1301–1311. [Google Scholar] [CrossRef] [Green Version]
  26. Hong, L.; Qian, Q.; Tang, D.; Wang, K.; Li, M.; Cheng, Z. A mutation in the rice chalcone isomerase gene causes the golden hull and internode 1 phenotype. Planta 2012, 236, 141–151. [Google Scholar] [CrossRef]
  27. Zhang, K.; Qian, Q.; Huang, Z.; Wang, Y.; Li, M.; Hong, L.; Zeng, D.; Gu, M.; Chu, C.; Cheng, Z. GOLD HULL AND INTERNODE2 Encodes a Primarily Multifunctional Cinnamyl-Alcohol Dehydrogenase in Rice. Plant Physiol. 2006, 140, 972–983. [Google Scholar] [CrossRef] [Green Version]
  28. Sun, X.; Zhang, Z.; Chen, C.; Wu, W.; Ren, N.; Jiang, C.; Yu, J.; Zhao, Y.; Zheng, X.; Yang, Q.; et al. The C–S–A gene system regulates hull pigmentation and reveals evolution of anthocyanin biosynthesis pathway in rice. J. Exp. Bot. 2018, 69, 1485–1498. [Google Scholar] [CrossRef] [Green Version]
  29. Shoeva, O.; Gordeeva, E.; Khlestkina, E. The Regulation of Anthocyanin Synthesis in the Wheat Pericarp. Molecules 2014, 19, 20266–20279. [Google Scholar] [CrossRef] [Green Version]
  30. Zhang, F.; Yang, L.; Huang, W.; Luo, X.; Xie, J.; Hu, B.; Chen, Y. Flavonoid Metabolic Profiles and Gene Mapping of Rice (Oryza sativa L.) Purple Gradient Grain Hulls. Rice 2022, 15, 43. [Google Scholar] [CrossRef]
  31. Ahmadikhah, A.; Marufinia, A. Effect of reduced plant height on drought tolerance in rice. 3 Biotech 2016, 6, 221. [Google Scholar] [CrossRef] [PubMed] [Green Version]
  32. Spielmeyer, W.; Ellis, M.H.; Chandler, P.M. Semidwarf (sd-1), “Green Revolution” Rice, Contains a Defective Gibberellin 20-Oxidase Gene. Proc. Natl. Acad. Sci. USA 2002, 99, 9043–9048. [Google Scholar] [CrossRef] [PubMed] [Green Version]
  33. Ma, J.; Zhang, K.; Huang, M.; Hector, S.B.; Liu, B.; Tong, C.; Liu, Q.; Zeng, J.; Gao, Y.; Xu, T.; et al. Involvement of Fenton chemistry in rice straw degradation by the lignocellulolytic bacterium Pantoea ananatis Sd-1. Biotechnol. Biofuels 2016, 9, 211. [Google Scholar] [CrossRef] [PubMed] [Green Version]
  34. Jung, Y.J.; Kim, J.H.; Lee, H.J.; Kim, D.H.; Yu, J.; Bae, S.; Cho, Y.; Kang, K.K. Generation and Transcriptome Profiling of Slr1-d7 and Slr1-d8 Mutant Lines with a New Semi-Dominant Dwarf Allele of SLR1 Using the CRISPR/Cas9 System in Rice. Int. J. Mol. Sci. 2020, 21, 5492. [Google Scholar] [CrossRef] [PubMed]
  35. Yamamuro, C.; Ihara, Y.; Wu, X.; Noguchi, T.; Fujioka, S.; Takatsuto, S.; Ashikari, M.; Kitano, H.; Matsuoka, M. Loss of function of a rice brassinosteroid insensitive1 homolog prevents internode elongation and bending of the lamina joint. Plant Cell 2000, 12, 1591–1605. [Google Scholar] [CrossRef] [Green Version]
  36. Iwamoto, M.; Kiyota, S.; Hanada, A.; Yamaguchi, S.; Takano, M. The Multiple Contributions of Phytochromes to the Control of Internode Elongation in Rice. Plant Physiol. 2011, 157, 1187–1195. [Google Scholar] [CrossRef] [Green Version]
  37. Lee, K.P.; Piskurewicz, U.; Turečková, V.; Carat, S.; Chappuis, R.; Strnad, M.; Fankhauser, C.; Lopez-Molina, L. Spatially and genetically distinct control of seed germination by phytochromes A and B. Genes Dev. 2012, 26, 1984–1996. [Google Scholar] [CrossRef] [Green Version]
  38. Fang, K.; Yi, X.; Dai, W.; Gao, H.; Cao, L. Effects of Integrated Rice-Frog Farming on Paddy Field Greenhouse Gas Emissions. Int. J. Environ. Res. Public Health 2019, 16, 1930. [Google Scholar] [CrossRef] [Green Version]
  39. Zeng, Q.; Xu, Y.; Jeppesen, E.; Gu, X.; Mao, Z.; Chen, H. Farming practices affect the amino acid profiles of the aquaculture Chinese mitten crab. PeerJ 2021, 9, e11605. [Google Scholar] [CrossRef]
  40. Long, P.; Huang, H.; Liao, X.; Fu, Z.; Zheng, H.; Chen, A.; Chen, C. Mechanism and capacities of reducing ecological cost through rice–duck cultivation. J. Sci. Food Agric. 2013, 93, 2881–2891. [Google Scholar] [CrossRef]
  41. Matsubara, K.; Yonemaru, J.; Kobayashi, N.; Ishii, T.; Yamamoto, E.; Mizobuchi, R.; Tsunematsu, H.; Yamamoto, T.; Kato, H.; Yano, M. A follow-up study for biomass yield QTLs in rice. PLoS ONE 2018, 13, e0206054. [Google Scholar] [CrossRef] [PubMed] [Green Version]
  42. Matsubara, K.; Yamamoto, E.; Kobayashi, N.; Ishii, T.; Tanaka, J.; Tsunematsu, H.; Yoshinaga, S.; Matsumura, O.; Yonemaru, J.; Mizobuchi, R.; et al. Improvement of Rice Biomass Yield through QTL-Based Selection. PLoS ONE 2016, 11, e0151830. [Google Scholar] [CrossRef] [PubMed] [Green Version]
  43. Mercati, F.; Sunseri, F. Genetic Diversity Assessment and Marker-Assisted Selection in Crops. Genes 2020, 11, 1481. [Google Scholar] [CrossRef] [PubMed]
  44. Chen, R.; Cheng, Y.; Han, S.; Van Handel, B.; Dong, L.; Li, X.; Xie, X. Whole genome sequencing and comparative transcriptome analysis of a novel seawater adapted, salt-resistant rice cultivar-sea rice 86. BMC Genom. 2017, 18, 147. [Google Scholar] [CrossRef] [Green Version]
  45. Basava, R.K.; Hash, C.T.; Mahendrakar, M.D.; Kishor, P.B.K.; Satyavathi, C.T.; Kumar, S.; Singh, R.B.; Yadav, R.S.; Gupta, R.; Srivastava, R.K. Discerning combining ability loci for divergent environments using chromosome segment substitution lines (CSSLs) in pearl millet. PLoS ONE 2019, 14, e0218916. [Google Scholar] [CrossRef] [Green Version]
  46. Beyene, Y.; Gowda, M.; Olsen, M.; Robbins, K.R.; Pérez-Rodríguez, P.; Alvarado, G.; Dreher, K.; Gao, S.Y.; Mugo, S.; Prasanna, B.M.; et al. Empirical Comparison of Tropical Maize Hybrids Selected Through Genomic and Phenotypic Selections. Front. Plant Sci. 2019, 10, 1502. [Google Scholar] [CrossRef] [Green Version]
  47. Ma, Y.; Mackon, E.; Jeazet Dongho Epse Mackon, G.C.; Zhao, Y.; Li, Q.; Dai, X.; Yao, Y.; Xia, X.; Nong, B.; Liu, P. Combined Analysis of BSA-Seq Based Mapping, RNA-Seq, and Metabolomic Unraveled Candidate Genes Associated with Panicle Grain Number in Rice (Oryza sativa L.). Biomolecules 2022, 12, 918. [Google Scholar] [CrossRef]
  48. Kersey, Y.M.; Wessells, N.K. Localization of actin filaments in internodal cells of characean algae. A scanning and transmission electron microscope study. J. Cell Biol. 1976, 68, 264–275. [Google Scholar] [CrossRef] [Green Version]
  49. Ellison, M.A.; McMahon, M.B.; Bonde, M.R.; Palmer, C.L.; Luster, D.G. In situ hybridization for the detection of rust fungi in paraffin embedded plant tissue sections. Plant Methods 2016, 12, 37. [Google Scholar] [CrossRef] [Green Version]
  50. Mackon, E.; Ma, Y.; Jeazet Dongho Epse Mackon, G.C.; Li, Q.; Zhou, Q.; Liu, P. Subcellular Localization and Vesicular Structures of Anthocyanin Pigmentation by Fluorescence Imaging of Black Rice (Oryza sativa L.) Stigma Protoplast. Plants 2021, 10, 685. [Google Scholar] [CrossRef]
  51. Gadin, J.R.; van’T Hooft, F.M.; Eriksson, P.; Folkersen, L. AllelicImbalance: An R/ bioconductor package for detecting, managing, and visualizing allele expression imbalance data from RNA sequencing. BMC Bioinform. 2015, 16, 194. [Google Scholar] [CrossRef] [PubMed] [Green Version]
  52. Backman, T.W.H.; Girke, T. SystemPipeR: NGS workflow and report generation environment. BMC Bioinform. 2016, 17, 388. [Google Scholar] [CrossRef] [PubMed] [Green Version]
  53. Jordon-Thaden, I.E.; Chanderbali, A.S.; Gitzendanner, M.A.; Soltis, D.E. Modified CTAB and TRIzol protocols improve RNA extraction from chemically complex Embryophyta. Appl. Plant Sci. 2015, 3, 1400105. [Google Scholar] [CrossRef] [PubMed]
  54. Brunel, D. An alternative, rapid method of plant DNA extraction for PCR analyses. Nucleic Acids Res. 1992, 20, 4676. [Google Scholar] [CrossRef] [PubMed] [Green Version]
  55. Chevallet, M.; Luche, S.; Rabilloud, T. Silver staining of proteins in polyacrylamide gels. Nat. Protoc. 2006, 1, 1852–1858. [Google Scholar] [CrossRef] [PubMed] [Green Version]
  56. Yun, Y.; Chung, C.; Lee, Y.; Na, H.; Lee, J.; Lee, S.; Lee, K.; Yoon, Y.; Kang, J.; Lee, H.; et al. QTL Mapping of Grain Quality Traits Using Introgression Lines Carrying Oryza rufipogon Chromosome Segments in Japonica Rice. Rice 2016, 9, 62. [Google Scholar] [CrossRef] [PubMed] [Green Version]
  57. Yang, L.; Lei, L.; Li, P.; Wang, J.; Wang, C.; Yang, F.; Chen, J.; Liu, H.; Zheng, H.; Xin, W.; et al. Identification of Candidate Genes Conferring Cold Tolerance to Rice (Oryza sativa L.) at the Bud-Bursting Stage Using Bulk Segregant Analysis Sequencing and Linkage Mapping. Front. Plant Sci. 2021, 12, 647239. [Google Scholar] [CrossRef]
  58. McCouch, S.R. Gene Nomenclature System for Rice. Rice 2008, 1, 72–84. [Google Scholar] [CrossRef] [Green Version]
  59. Jaari, S.; Li, M.H.; Merila, J. A first-generation microsatellite-based genetic linkage map of the Siberian jay (Perisoreus infaustus): Insights into avian genome evolution. BMC Genom. 2009, 10, 1. [Google Scholar] [CrossRef] [PubMed] [Green Version]
  60. Zhou, H.; Wang, X.; Mo, Y.; Li, Y.; Yan, L.; Li, Z.; Shu, W.; Cheng, L.; Huang, F.; Qiu, Y. Genetic analysis and fine mapping of the gall midge resistance gene Gm5 in rice (Oryza sativa L.). Theor. Appl. Genet. 2020, 133, 2021–2033. [Google Scholar] [CrossRef]
  61. Liu, J.M.; Park, S.J.; Huang, J.; Lee, E.J.; Xuan, Y.H.; Je, B.I.; Kumar, V.; Priatama, R.A.; Raj K, V.; Kim, S.H.; et al. Loose Plant Architecture1 (LPA1) determines lamina joint bending by suppressing auxin signalling that interacts with C-22-hydroxylated and 6-deoxo brassinosteroids in rice. J. Exp. Bot. 2016, 67, 1883–1895. [Google Scholar] [CrossRef] [PubMed] [Green Version]
  62. Park, G.; Park, J.; Yoon, J.; Yu, S.; An, G. A RING finger E3 ligase gene, Oryza sativa Delayed Seed Germination 1 (OsDSG1), controls seed germination and stress responses in rice. Plant Mol. Biol. 2010, 74, 467–478. [Google Scholar] [CrossRef] [PubMed]
  63. Yang, C.; Ma, Y.; Li, J. The rice YABBY4 gene regulates plant growth and development through modulating the gibberellin pathway. J. Exp. Bot. 2016, 67, 5545–5556. [Google Scholar] [CrossRef] [PubMed] [Green Version]
  64. Huo, X.; Wu, S.; Zhu, Z.; Liu, F.; Fu, Y.; Cai, H.; Sun, X.; Gu, P.; Xie, D.; Tan, L.; et al. NOG1 increases grain production in rice. Nat. Commun. 2017, 8, 1497. [Google Scholar] [CrossRef] [PubMed] [Green Version]
  65. Nakagomi, K.; Shigemune, A.; Sasahara, H.; Arai, T.; Hirabayashi, H.; Yamanouchi, U.; Ideta, O. Finding a novel QTL responsible for kernel cracking resistance from CSSLs of ‘Itadaki’ (O. sativa L.) × donor O. rufipogon. Breed. Sci. 2020, 70, 567–575. [Google Scholar] [CrossRef] [PubMed]
  66. Surapaneni, M.; Balakrishnan, D.; Mesapogu, S.; Addanki, K.R.; Yadavalli, V.R.; Tripura Venkata, V.G.N.; Neelamraju, S. Identification of Major Effect QTLs for Agronomic Traits and CSSLs in Rice from Swarna/Oryza nivara Derived Backcross Inbred Lines. Front. Plant Sci. 2017, 8, 1027. [Google Scholar] [CrossRef] [PubMed] [Green Version]
  67. Wang, D.; Zhou, K.; Xiang, S.; Zhang, Q.; Li, R.; Li, M.; Liang, P.; Farkhanda, N.; He, G.; Ling, Y.; et al. Identification, pyramid and candidate genes of QTLs for associated traits based on a dense erect panicle rice CSSL-Z749 and five SSSLs, three DSSLs and one TSSL. Rice 2021, 14, 55. [Google Scholar] [CrossRef] [PubMed]
  68. Yang, C.; Zhang, T.; Wang, H.; Zhao, N.; Liu, B. Heritable alteration in salt-tolerance in rice induced by introgression from wild rice (Zizania latifolia). Rice 2012, 5, 36. [Google Scholar] [CrossRef] [Green Version]
  69. Zhang, K.; Su, J.; Xu, M.; Zhou, Z.; Zhu, X.; Ma, X.; Hou, J.; Tan, L.; Zhu, Z.; Cai, H.; et al. A common wild rice-derived BOC1 allele reduces callus browning in indica rice transformation. Nat. Commun. 2020, 11, 443. [Google Scholar] [CrossRef] [Green Version]
  70. Cen, W.; Zhao, W.; Ma, M.; Lu, S.; Liu, J.; Cao, Y.; Zeng, Z.; Wei, H.; Wang, S.; Li, R.; et al. The Wild Rice Locus CTS-12 Mediates ABA-Dependent Stomatal Opening Modulation to Limit Water Loss Under Severe Chilling Stress. Front. Plant Sci. 2020, 11, 575699. [Google Scholar] [CrossRef]
  71. Cen, W.; Liu, J.; Lu, S.; Jia, P.; Yu, K.; Han, Y.; Li, R.; Luo, J. Comparative proteomic analysis of QTL CTS-12 derived from wild rice (Oryza rufipogon Griff.), in the regulation of cold acclimation and de-acclimation of rice (Oryza sativa L.) in response to severe chilling stress. BMC Plant Biol. 2018, 18, 163. [Google Scholar] [CrossRef] [PubMed]
  72. Pan, Y.; Chen, L.; Zhao, Y.; Guo, H.; Li, J.; Rashid, M.A.R.; Lu, C.; Zhou, W.; Yang, X.; Liang, Y.; et al. Natural Variation in OsMKK3 Contributes to Grain Size and Chalkiness in Rice. Front. Plant Sci. 2021, 12, 784037. [Google Scholar] [CrossRef] [PubMed]
  73. Ando, T.; Yamamoto, T.; Shimizu, T.; Ma, X.F.; Shomura, A.; Takeuchi, Y.; Lin, S.Y.; Yano, M. Genetic dissection and pyramiding of quantitative traits for panicle architecture by using chromosomal segment substitution lines in rice. Theor. Appl. Genet. 2008, 116, 881–890. [Google Scholar] [CrossRef] [PubMed]
  74. Qiao, W.; Qi, L.; Cheng, Z.; Su, L.; Li, J.; Sun, Y.; Ren, J.; Zheng, X.; Yang, Q. Development and characterization of chromosome segment substitution lines derived from Oryza rufipogon in the genetic background of O. sativa spp. indica cultivar 9311. BMC Genom. 2016, 17, 580. [Google Scholar] [CrossRef] [Green Version]
  75. Ma, X.; Han, B.; Tang, J.; Zhang, J.; Cui, D.; Geng, L.; Zhou, H.; Li, M.; Han, L. Construction of chromosome segment substitution lines of Dongxiang common wild rice (Oryza rufipogon Griff.) in the background of the japonica rice cultivar Nipponbare (Oryza sativa L.). Plant Physiol. Biochem. 2019, 144, 274–282. [Google Scholar] [CrossRef]
  76. Bessho-Uehara, K.; Furuta, T.; Masuda, K.; Yamada, S.; Angeles-Shim, R.B.; Ashikari, M.; Takashi, T. Construction of rice chromosome segment substitution lines harboring Oryza barthii genome and evaluation of yield-related traits. Breed. Sci. 2017, 67, 408–415. [Google Scholar] [CrossRef] [Green Version]
  77. Furuta, T.; Uehara, K.; Angeles-Shim, R.B.; Shim, J.; Ashikari, M.; Takashi, T. Development and evaluation of chromosome segment substitution lines (CSSLs) carrying chromosome segments derived from Oryza rufipogon in the genetic background of Oryza sativa L. Breed. Sci. 2014, 63, 468–475. [Google Scholar] [CrossRef] [Green Version]
  78. Wang, J.; Wang, J.; Wang, X.; Li, R.; Chen, B. Proteomic response of hybrid wild rice to cold stress at the seedling stage. PLoS ONE 2018, 13, e0198675. [Google Scholar] [CrossRef]
  79. Wang, Y.; Cao, L.; Zhang, Y.; Cao, C.; Liu, F.; Huang, F.; Qiu, Y.; Li, R.; Lou, X. Map-based cloning and characterization of BPH29, a B3 domain-containing recessive gene conferring brown planthopper resistance in rice. J. Exp. Bot. 2015, 66, 6035–6045. [Google Scholar] [CrossRef] [Green Version]
  80. Du, B.; Zhang, W.; Liu, B.; Hu, J.; Wei, Z.; Shi, Z.; He, R.; Zhu, L.; Chen, R.; Han, B.; et al. Identification and characterization of Bph14, a gene conferring resistance to brown planthopper in rice. Proc. Natl. Acad. Sci. USA 2009, 106, 22163–22168. [Google Scholar] [CrossRef]
  81. Fujino, K.; Nishimura, T.; Kiuchi, H.; Hirayama, Y.; Sato, T. Phenotypic changes during 100-year rice breeding programs in Hokkaido. Breed. Sci. 2017, 67, 528–534. [Google Scholar] [CrossRef] [PubMed] [Green Version]
  82. Li, Z.; Xue, Y.; Zhou, H.; Li, Y.; Usman, B.; Jiao, X.; Wang, X.; Liu, F.; Qin, B.; Li, R.; et al. High-resolution mapping and breeding application of a novel brown planthopper resistance gene derived from wild rice (Oryza. rufipogon Griff). Rice 2019, 12, 41. [Google Scholar] [CrossRef] [PubMed] [Green Version]
  83. Li, J.; Zhang, W.; Wu, H.; Guo, T.; Liu, X.; Wan, X.; Jin, J.; Hanh, T.T.T.; Thoa, N.T.N.; Chen, M.; et al. Fine mapping of stable QTLs related to eating quality in rice (Oryza sativa L.) by CSSLs harboring small target chromosomal segments. Breed. Sci. 2011, 61, 338–346. [Google Scholar] [CrossRef] [PubMed] [Green Version]
  84. Devi, S.J.S.R.; Singh, K.; Umakanth, B.; Vishalakshi, B.; Rao, K.V.S.; Suneel, B.; Sharma, S.K.; Kadambari, G.K.M.; Prasad, M.S.; Senguttvel, P.; et al. Identification and Characterization of a Large Effect QTL from Oryza glumaepatula Revealed Pi68(t) as Putative Candidate Gene for Rice Blast Resistance. Rice 2020, 13, 17. [Google Scholar] [CrossRef]
  85. Fuchs, E.J.; Martínez, A.M.; Calvo, A.; Muñoz, M.; Arrieta-Espinoza, G. Genetic diversity in Oryza glumaepatula wild rice populations in Costa Rica and possible gene flow from O. sativa. PeerJ 2016, 4, e1875. [Google Scholar] [CrossRef] [Green Version]
  86. Cui, D.; Tang, C.; Lu, H.; Li, J.; Ma, X.; A, X.; Han, B.; Yang, Y.; Dong, C.; Zhang, F.; et al. Genetic differentiation and restricted gene flow in rice landraces from Yunnan, China: Effects of isolation-by-distance and isolation-by-environment. Rice 2021, 14, 54. [Google Scholar] [CrossRef]
  87. Liu, Q.; Qin, J.; Li, T.; Liu, E.; Fan, D.; Edzesi, W.M.; Liu, J.; Jiang, J.; Liu, X.; Xiao, L.; et al. Fine Mapping and Candidate Gene Analysis of qSTL3, a Stigma Length-Conditioning Locus in Rice (Oryza sativa L.). PLoS ONE 2015, 10, e0127938. [Google Scholar] [CrossRef]
  88. Heang, D.; Sassa, H. Antagonistic actions of HLH/bHLH proteins are involved in grain length and weight in rice. PLoS ONE 2012, 7, e31325. [Google Scholar] [CrossRef] [Green Version]
  89. Qi, L.; Sun, Y.; Li, J.; Su, L.; Zheng, X.; Wang, X.; Li, K.; Yang, Q.; Qiao, W. Identify QTLs for grain size and weight in common wild rice using chromosome segment substitution lines across six environments. Breed. Sci. 2017, 67, 472–482. [Google Scholar] [CrossRef] [Green Version]
  90. Nan, J.; Feng, X.; Wang, C.; Zhang, X.; Wang, R.; Liu, J.; Yuan, Q.; Jiang, G.; Lin, S. Improving rice grain length through updating the GS3 locus of an elite variety Kongyu 131. Rice 2018, 11, 21. [Google Scholar] [CrossRef]
  91. Fan, C.; Xing, Y.; Mao, H.; Lu, T.; Han, B.; Xu, C.; Li, X.; Zhang, Q. GS3, a major QTL for grain length and weight and minor QTL for grain width and thickness in rice, encodes a putative transmembrane protein. Theor. Appl. Genet. 2006, 112, 1164–1171. [Google Scholar] [CrossRef] [PubMed]
  92. Wang, Y.; Xiong, G.; Hu, J.; Jiang, L.; Yu, H.; Xu, J.; Fang, Y.; Zeng, L.; Xu, E.; Xu, J.; et al. Copy number variation at the GL7 locus contributes to grain size diversity in rice. Nat. Genet. 2015, 47, 944–948. [Google Scholar] [CrossRef]
  93. Liu, S.; Hua, L.; Dong, S.; Chen, H.; Zhu, X.; Jiang, J.; Zhang, F.; Li, Y.; Fang, X.; Chen, F. OsMAPK6, a mitogen-activated protein kinase, influences rice grain size and biomass production. Plant J. 2015, 84, 672–681. [Google Scholar] [CrossRef]
  94. Guo, T.; Chen, K.; Dong, N.; Shi, C.; Ye, W.; Gao, J.; Shan, J.; Lin, H. GRAIN SIZE AND NUMBER1 Negatively Regulates the OsMKKK10-OsMKK4-OsMPK6 Cascade to Coordinate the Trade-off between Grain Number per Panicle and Grain Size in Rice. Plant Cell 2018, 30, 871–888. [Google Scholar] [CrossRef] [PubMed] [Green Version]
  95. Wang, S.; Li, S.; Liu, Q.; Wu, K.; Zhang, J.; Wang, S.; Wang, Y.; Chen, X.; Zhang, Y.; Gao, C.; et al. The OsSPL16-GW7 regulatory module determines grain shape and simultaneously improves rice yield and grain quality. Nat. Genet. 2015, 47, 949–954. [Google Scholar] [CrossRef] [PubMed]
  96. Feng, Y.; Yuan, X.; Wang, Y.; Yang, Y.; Zhang, M.; Yu, H.; Xu, Q.; Wang, S.; Niu, X.; Wei, X. Validation of a QTL for Grain Size and Weight Using an Introgression Line from a Cross between Oryza sativa and Oryza minuta. Rice 2021, 14, 43. [Google Scholar] [CrossRef] [PubMed]
  97. Xin, F.; Zhu, T.; Wei, S.; Han, Y.; Zhao, Y.; Zhang, D.; Ma, L.; Ding, Q. QTL Mapping of Kernel Traits and Validation of a Major QTL for Kernel Length-Width Ratio Using SNP and Bulked Segregant Analysis in Wheat. Sci. Rep. 2020, 10, 25. [Google Scholar] [CrossRef] [PubMed] [Green Version]
  98. Dastidar, K.G.; Maitra, S.; Goswami, L.; Roy, D.; Das, K.P.; Majumder, A.L. An Insight into the Molecular Basis of Salt Tolerance of L-myo-Inositol 1-P Synthase (PcINO1) from Porteresia coarctata (Roxb.) Tateoka, a Halophytic Wild Rice. Plant Physiol. 2006, 140, 1279–1296. [Google Scholar] [CrossRef] [Green Version]
  99. Luo, J.; Liu, H.; Zhou, T.; Gu, B.; Huang, X.; Shangguan, Y.; Zhu, J.; Li, Y.; Zhao, Y.; Wang, Y.; et al. An-1 Encodes a Basic Helix-Loop-Helix Protein That Regulates Awn Development, Grain Size, and Grain Number in Rice. Plant Cell 2013, 25, 3360–3376. [Google Scholar] [CrossRef] [Green Version]
  100. Zhou, Y.; Lu, D.; Li, C.; Luo, J.; Zhu, B.; Zhu, J.; Shangguan, Y.; Wang, Z.; Sang, T.; Zhou, B.; et al. Genetic Control of Seed Shattering in Rice by the APETALA2 Transcription Factor SHATTERING ABORTION1. Plant Cell 2012, 24, 1034–1048. [Google Scholar] [CrossRef]
  101. Su, S.; Hong, J.; Chen, X.; Zhang, C.; Chen, M.; Luo, Z.; Chang, S.; Bai, S.; Liang, W.; Liu, Q.; et al. Gibberellins orchestrate panicle architecture mediated by DELLA-KNOX signalling in rice. Plant Biotechnol. J. 2021, 19, 2304–2318. [Google Scholar] [CrossRef] [PubMed]
  102. Nawaz, G.; Usman, B.; Zhao, N.; Han, Y.; Li, Z.; Wang, X.; Liu, Y.; Li, R. CRISPR/Cas9 Directed Mutagenesis of OsGA20ox2 in High Yielding Basmati Rice (Oryza sativa L.) Line and Comparative Proteome Profiling of Unveiled Changes Triggered by Mutations. Int. J. Mol. Sci. 2020, 21, 6170. [Google Scholar] [CrossRef] [PubMed]
  103. Zhu, H.; Liu, Z.; Fu, X.; Dai, Z.; Wang, S.; Zhang, G.; Zeng, R.; Liu, G. Detection and characterization of epistasis between QTLs on plant height in rice using single segment substitution lines. Breed. Sci. 2015, 65, 192–200. [Google Scholar] [CrossRef] [PubMed] [Green Version]
  104. Nakamura, A.; Fujioka, S.; Sunohara, H.; Kamiya, N.; Hong, Z.; Inukai, Y.; Miura, K.; Takatsuto, S.; Yoshida, S.; Ueguchi-Tanaka, M.; et al. The Role of OsBRI1 and Its Homologous Genes, OsBRL1 and OsBRL3, in Rice. Plant Physiol. 2006, 140, 580–590. [Google Scholar] [CrossRef] [PubMed] [Green Version]
  105. Morinaka, Y.; Sakamoto, T.; Inukai, Y.; Agetsuma, M.; Kitano, H.; Ashikari, M.; Matsuoka, M. Morphological Alteration Caused by Brassinosteroid Insensitivity Increases the Biomass and Grain Production of Rice. Plant Physiol. 2006, 141, 924–931. [Google Scholar] [CrossRef] [Green Version]
  106. Zhao, J.; Wu, C.; Yuan, S.; Yin, L.; Sun, W.; Zhao, Q.; Zhao, B.; Li, X. Kinase activity of OsBRI1 is essential for brassinosteroids to regulate rice growth and development. Plant Sci. 2013, 199–200, 113–120. [Google Scholar] [CrossRef]
  107. Wang, Z.; Cheng, D.; Fan, C.; Zhang, C.; Zhang, C.; Liu, Z. Cell Type-Specific Differentiation Between Indica and Japonica Rice Root Tip Responses to Different Environments Based on Single-Cell RNA Sequencing. Front. Genet. 2021, 12, 659500. [Google Scholar] [CrossRef]
  108. Helal, G.A. Bioconversion of straw into improved fodder: Mycoprotein production and cellulolytic acivity of rice straw decomposing fungi. Mycobiology 2005, 33, 90–96. [Google Scholar] [CrossRef] [Green Version]
  109. Silva, S.; Costa, E.M.; Calhau, C.; Morais, R.M.; Pintado, M.E. Anthocyanin extraction from plant tissues: A review. Crit. Rev. Food Sci. Nutr. 2017, 57, 3072–3083. [Google Scholar] [CrossRef]
  110. Alappat, B.; Alappat, J. Anthocyanin Pigments: Beyond Aesthetics. Molecules 2020, 25, 5500. [Google Scholar] [CrossRef]
  111. Mackon, E.; Jeazet Dongho Epse Mackon, G.C.; Ma, Y.; Kashif, M.H.; Ali, N.; Usman, B.; Liu, P. Recent Insights into Anthocyanin Pigmentation, Synthesis, Trafficking, and Regulatory Mechanisms in Rice (Oryza sativa L.) Caryopsis. Biomolecules 2021, 11, 394. [Google Scholar] [CrossRef] [PubMed]
  112. Oh, J.; Lee, Y.; Byeon, E.; Kang, B.; Kyeoung, D.; Kim, C. Whole-genome resequencing and transcriptomic analysis of genes regulating anthocyanin biosynthesis in black rice plants. 3 Biotech 2018, 8, 115. [Google Scholar] [CrossRef] [PubMed] [Green Version]
  113. Kim, D.H.; Park, S.; Lee, J.Y.; Ha, S.H.; Lee, J.G.; Lim, S.H. A Rice B-Box Protein, OsBBX14, Finely Regulates Anthocyanin Biosynthesis in Rice. Int. J. Mol. Sci. 2018, 19, 2190. [Google Scholar] [CrossRef] [PubMed]
Figure 1. Phenotypic morphology of DP15 and 93-11. (a), plant phenotype of DP15 and 93-11, bar = 20 cm; (b), panicle morphology of DP15 and 93-11, Bar = 5 cm; (c), phenotype of mature grain of DP15 and 93-11, bar = 1 cm; (d), length of brown rice of DP15 and 93-11, bar = 1 cm; (e), width of brown rice of DP15 and 93-11, bar = 1 cm.
Biomolecules 12 01850 g001
Figure 2. Graphical genotypes of the 59 lines DP15-CSSLs. Note: Black bars indicate homozygous chromosome substituted segments derived from DP15; Yellow bars indicate heterozygous substituted segments derived from DP15; Grey bars indicate the genetic background of recipient parent 93-11.
Biomolecules 12 01850 g002
Figure 3. Frequency distribution of 59 DP15-CSSLs and their two parents on four grain traits over two years. Note: (a), phenotypic distribution of TGW in DP15, 93-11, and the DP15-CSSLs; (b), phenotypic distribution of GL in DP15, 93-11, and the DP15-CSSLs; (c), phenotypic distributions of GW in DP15, 93-11, and the DP15-CSSLs; (d), phenotypic distribution of GLWR in DP15, 93-11, and the DP15-CSSLs; The marked solid arrow lines and dotted arrow lines indicate the phenotypic distribution of DP15 and 93-11 respectively.
Biomolecules 12 01850 g003
Figure 4. Detection of QTLs related to four grain traits in the DP15-CSSLs. (a), detection of QTLs related to TGW in DP15-CSSLs; (b), detection of QTLs related to GL in DP15-CSSLs; (c), detection of QTLs related to GW in DP15-CSSLs; (d), detection of QTLs related to GLWR in DP15-CSSLs.
Biomolecules 12 01850 g004
Figure 5. Phenotype of a PH-related DP15-CSSL line. (a), the plant architecture of ZN6 and 93-11 at heading stage, bar = 50 cm; (b), the internode of ZN6 and 93-11 at heading stage, bar = 5 cm; (c), the histogram of internode length of ZN6 and 93-11 at heading stage; the sign “*” in Figure 5c indicates a p ≤ 0.05 level; The sign “**” in Figure 5c indicates a p ≤ 0.01 level.
Biomolecules 12 01850 g005
Figure 6. Tissue section, vessel scanning, and paraffin section figures of the uppermost internode at the grain filling stage. (a), the tissue section figure of the uppermost internode of ZN6, bar = 100 μm; (b), the tissue section figure of the uppermost internode of 93-11, bar = 100 μm; (c), the horizontal paraffin section figure of the uppermost internode of ZN6, bar = 100 μm; (d), the horizontal paraffin section figure of the uppermost internode of 93-11, bar = 100 μm; (e), the horizontal SEM section figure of the uppermost internode of ZN6, bar = 100 μm; (f), the horizontal SEM section figure of the uppermost internode of 93-11, bar = 100 μm; (g), the horizontal paraffin section figure of the uppermost internode of ZN6 and 93-11 at heading stage, bar = 200 μm; (h), the horizontal paraffin section figure of the uppermost internode of ZN6 and 93-11 at heading stage, bar = 200 μm; (i), the longitudinal paraffin section figure of the uppermost internode of ZN6, bar = 100 μm (j), the longitudinal paraffin section figure of the uppermost internode of 93-11, bar = 100 μm.
Biomolecules 12 01850 g006
Figure 7. Genetic mapping of the qPH1.1 in rice. (a), the QTL detection figure of qPH1.1; (b), the BSA analysis for qPH1.1; (c), the recombinant identification and genetic mapping for qPH1.1.
Biomolecules 12 01850 g007
Figure 8. Phenotype of ZN32, an LMC-related DP15-CSSL line. (a), the plant architecture of ZN32 and 93-11 at heading stage, bar = 20 cm; (bd) in Figure 8 show the leaf margin morphology of ZN32 and 93-11 at heading stage, the red arrow in (bd) indicates the leaf margin site, the bar in (bd) are 1 cm, 5 mm, and 5 mm, respectively; (e), the ligule and auricle color of ZN32 and 93-11 at heading stage, the red arrow in (e) shows the auricle site, the scale bar = 5 mm; (f), the basal shoot of ZN32 and 93-11 at heading stage, the red arrow in (f) shows the basal shoot region, bar = 5 cm; (g), the leaf collar phenotype of ZN32 and 93-11 at heading stage, the red arrow in (g) shows the lamina joint site, bar = 5 mm; (h), the apiculus color of ZN32 and 93-11 at heading stage, the yellow arrow in (h) shows apiculus site; the red arrow shows stigma site, bar = 1 mm; (i), the stigma color of ZN32 and 93-11 at heading stage; The red arrow shows stigma site, bar = 1 mm; (j), the rice basal culm with leaf sheath surrounded of ZN32 and 93-11 at heading stage, the white arrow in (j) shows the zone of inner leaf sheath, bar = 5 mm; (k), the rice basal culm of ZN32 and 93-11 at heading stage, the white arrow in Figure 8k shows the borders of the culm, bar = 5 mm.
Biomolecules 12 01850 g008
Figure 9. Phenotypic comparison of protoplasts extracted from ZN32 and 93-11 stigma under confocal microscopy. Note: (af), the protoplast of ZN32 showing fluorescence; (gl), the protoplast of 93-11 showing no fluorescence; V indicates the position of vacuole; N indicates the position of nucleus in protoplast, bar = 5 μm.
Biomolecules 12 01850 g009
Figure 10. Genetic mapping of the qLMC6.1 in rice. (a), the QTL detection figure of qLMC6.1; (b), the bulk segregation analysis for the qLMC6.1; (c), the recombinants identification and genetic mapping for the qLMC6.1; (I), simple model of Chromosome 6; (II), the distribution of primers used for primary mapping; (III), the distribution of primers used for fine mapping; (IV), the screening for recombinants for the mapping of qLMC6.1.
Biomolecules 12 01850 g010
Publisher’s Note: MDPI stays neutral with regard to jurisdictional claims in published maps and institutional affiliations.

