 Georgia C. Eizenga1*‡
 HyunJung Kim2†‡
 Janelle K. H. Jung2‡
 Anthony J. Greenberg3
 Jeremy D. Edwards1
 Maria Elizabeth B. Naredo4†
 Maria Celeste N. Banaticla-Hilario4
 Sandra E. Harrington2
 Yuxin Shi2Jennifer A. Kimball2†Lisa A. Harper2
 Kenneth L. McNally4
 Susan R. McCouch2*
- 1Dale Bumpers National Rice Research Center, USDA-ARS, Stuttgart, AR, United States
- 2Plant Breeding and Genetics Section, School of Integrative Plant Science, Cornell University, Ithaca, NY, United States
- 3Bayesic Research LLC., Ithaca, NY, United States
- 4International Rice Research Institute, Los Baños, Philippines
Crop wild relatives represent valuable reservoirs of variation for breeding, but their populations are threatened in natural habitats, are sparsely represented in genebanks, and most are poorly characterized. The focus of this study is the Oryza rufipogon species complex (ORSC), wild progenitor of Asian rice (Oryza sativa L.). The ORSC comprises perennial, annual and intermediate forms which were historically designated as O. rufipogon, O. nivara, and O. sativa f. spontanea (or Oryza spp., an annual form of mixed O. rufipogon/O. nivara and O. sativa ancestry), respectively, based on non-standardized morphological, geographical, and/or ecologically-based species definitions and boundaries. Here, a collection of 240 diverse ORSC accessions, characterized by genotyping-by-sequencing (113,739 SNPs), was phenotyped for 44 traits associated with plant, panicle, and seed morphology in the screenhouse at the International Rice Research Institute, Philippines. These traits included heritable phenotypes often recorded as characterization data by genebanks. Over 100 of these ORSC accessions were also phenotyped in the greenhouse for 18 traits in Stuttgart, Arkansas, and 16 traits in Ithaca, New York, United States. We implemented a Bayesian Gaussian mixture model to infer accession groups from a subset of these phenotypic data and ascertained three phenotype-based group assignments. We used concordance between the genotypic subpopulations and these phenotype-based groups to identify a suite of phenotypic traits that could reliably differentiate the ORSC populations, whether measured in tropical or temperate regions. The traits provide insight into plant morphology, life history (perenniality versus annuality) and mating habit (self- versus cross-pollinated), and are largely consistent with genebank species designations. One phenotypic group contains predominantly O. rufipogon accessions characterized as perennial and largely out-crossing and one contains predominantly O. nivara accessions characterized as annual and largely inbreeding. From these groups, 42 “core” O. rufipogon and 25 “core” O. nivara accessions were identified for domestication studies. The third group, comprising 20% of our collection, has the most accessions identified as Oryza spp. (51.2%) and levels of O. sativa admixture accounting for more than 50% of the genome. This third group is potentially useful as a “pre-breeding” pool for breeders attempting to incorporate novel variation into elite breeding lines.
Introduction
Wild relatives of domesticated crop species are some of the greatest sources of untapped genetic variation available to plant breeders as they confront the challenges of a changing climate. Yet populations of crop wild relatives are underrepresented in genebanks, threatened in their natural environments, and poorly characterized in both ex situ and in situ collections. The Oryza rufipogon species complex (ORSC), previously referred to as O. rufipogon Griff. or O. perennis Moench, is the wild progenitor of Asian rice (Oryza sativa L.) and is comprised of perennial, annual, and intermediate ecotypes (Sano et al., 1980; Oka, 1988). As summarized in Supplementary Table 1, the perennial ecotype exhibits vigorous vegetative growth, is largely out-crossing, and is found in areas which are continuously wet while the annual ecotype shows less vigorous vegetative growth, is primarily in-breeding, and is found in areas that are seasonally wet (Oka and Morishima, 1967; Morishima et al., 1984; Vaughan et al., 2008). In accordance with these differences in life history, the perennial form is capable of reproducing clonally via stolons, typically has low seed productivity, is late flowering and photoperiod sensitive, while the annual form lacks stolons, has high seed productivity, is frequently early-flowering and photoperiod insensitive (Morishima et al., 1984; Barbier, 1989a,b; Barbier et al., 1991; Morishima, 2001; Vaughan et al., 2003, 2008; Cai et al., 2004). An extensive survey of both annual and perennial ecotypes of the ORSC led Sharma and Shastry (1965) to treat the annual form as a separate species, designated O. nivara, as originally suggested by Chatterjee (1948), to distinguish it from the perennial O. rufipogon. A weedy, intermediate form is classified as O. sativa f. spontanea Roschev (Roschevicz, 1931; Oka, 1988) and sometimes erroneously designated O. spontanea (Oka, 1974; Sano et al., 1980; Vaughan, 1989; Hill, 2010). Weedy rice is considered an annual of mixed O. rufipogon/O. nivara and O. sativa ancestry (Morishima et al., 1961; Chang, 1976; Vaughan et al., 2001; Sharma, 2003).
To this day, wide differences in the nomenclature and trait-based definitions assigned to the wild ancestor of O. sativa persist in rice genebank databases and research labs around the world. According to the online database of the International Rice Germplasm Collection (IRGC)1 the list of available ORSC accessions includes 846 O. rufipogon, 1,455 O. nivara, and 1,134 accessions listed as either ‘Oryza spp.’ or ‘Oryza hybr.’. Many of the Oryza spp. or Oryza hybr. were previously designated as O. spontanea (O. sativa f. spontanea) or referred to as hybrids between O. sativa and O. rufipogon and/or O. nivara. The online wild strain database of the Japanese National Institute of Genetics, Oryzabase (Kurata and Yamazaki, 2006; Yamazaki et al., 2010), acknowledges confusion in the wild rice taxonomy and nomenclature, including a distinction between O. nivara and O. rufipogon based on ecology and life habit, but clearly states its use of the sensu lato classification of O. rufipogon as a single species with a continuous range of annual, perennial, and intermediate types as held by core collectors Morishima and colleagues (Morishima et al., 1961). There are 682 accessions in Oryzabase designated as ‘O. rufipogon’ with additional, but incomplete information on former species designations (i.e., ‘O. perennis’, ‘O. perennis (O. nivara),’ or ‘O. sativa f. spontanea,’), and life habit designations, such as annual or perennial2.
While the species designations originally assigned to accessions in the IRGC have persisted largely unchanged through the decades, there has been a paradigm shift in biology from morphology-based to genetic identity-based species definitions. In the case of the ORSC, studies using molecular markers (isozymes, RFLPs, SSRs, SINEs and other indels, and SNPs) present conflicting and often contradictory results that collectively fail to support the existence of two, well-differentiated species. Global studies of genomic diversity in the ORSC document three to eight genetically distinct groups (Londo et al., 2006; Zheng and Ge, 2010; Huang et al., 2012; Banaticla-Hilario et al., 2013a,b; Liu et al., 2015; Kim et al., 2016) more closely associated with geography than with life-habit. Pronounced genetic differentiation has been reported between O. rufipogon and O. nivara only in studies involving local collections of germplasm from South Asia (Samal et al., 2018) and Southeast Asia (Kuroda et al., 2006; Banaticla-Hilario et al., 2013a), where both species occur sympatrically but remain differentiated due to differences in flowering time and ecological adaptation. Genetic differentiation has not been documented in China or Oceania where native populations of O. nivara are largely absent (Vaughan, 1994; Liu et al., 2015).
Several studies based on genome-wide SNPs have examined relationships among ORSC accessions and among ORSC and O. sativa subpopulations. A study by Huang et al. (2012) examined a panel of 446 ORSC accessions and 1,083 O. sativa cultivars that had been genotyped with ∼5M SNPs and identified three major groups of ORSC accessions using a neighbor-joining tree. These groups were significantly correlated with geographic distribution and were referred to as OrI, OrII and OrIII. Subsequently, OrI was divided into two sub-clades, where OrIa included ORSC accessions and rice belonging to the O. sativa-indica subpopulation and OrIb included ORSC and O. sativa-aus rices; OrIII was also divided into two sub-clades, where OrIIIa included ORSC accessions from Southern China as well as O. sativa-japonica rices, and OrIIIb included ORSC accessions that clustered independently of O. sativa.
The ORSC dataset generated by Huang et al. (2012) was subsequently re-analyzed by three independent research groups: Civán et al. (2015), Wang et al. (2017), and Choi and Purugganan (2018). In each case the authors reached very different conclusions about the subpopulation structure of the ORSC and relationships with the cultivated gene pools of O. sativa. These subsequent studies revealed evidence of substantial gene flow from domesticated groups into wild populations and suggested that introgression rather than phylogenetic relationship was a primary driver of the ORSC groups reported by Huang et al. (2012). Use of larger K values (population number) and local ancestry estimation techniques helped to resolve the heavily O. sativa-admixed wild groups as distinct from independent wild populations. The analysis by Wang et al. (2017) combined the sequence data of 435 ORSC accessions (Huang et al., 2012) with sequencing data from 203 O. sativa accessions included in the Rice Minicore collection (Wang et al., 2016). Subsequent STRUCTURE analysis (K = 9) ascertained six ORSC subpopulations: four unique ORSC subpopulations that were correlated with geographic distribution and two that clustered with O. sativa subpopulations. Of these, Or-A accessions had the broadest range with the highest proportion from Oceania, Or-B accessions were almost exclusively found in China, Or-C had the highest proportion from West India and Sri Lanka, and Or-D was mainly from the SE Asia, Bangladesh, and East India, Or-E accessions clustered with O. sativa-aus accessions, and Or-F clustered with O. sativa-indica (Wang et al., 2017). Of note, about 42% of these ORSC accessions were deemed to be substantially admixed, thus could not be assigned to a single ancestry group.
To further disentangle the population dynamics of the ORSC, a different collection of 286 accessions from the IRGC was genotyped using genotyping-by-sequencing (113,739 SNPs) and evaluated at 25 polymorphic sites in the chloroplast genome (Kim et al., 2016). Six wild subpopulation groups were identified; three were closely related to O. sativa-indica, -aus, and -japonica, respectively, while the other three subpopulations were genetically divergent, had unique chloroplast haplotypes, and were located at the geographical extremes of the species range.
Another study examined local differentiation between O. rufipogon and O. nivara using a collection of 52 pairs of sympatric O. rufipogon and O. nivara accessions that were phenotyped for 32 traits (Banaticla-Hilario et al., 2013a) and genotyped with 29 SSR markers (Banaticla-Hilario et al., 2013b). The genotypic neighbor-joining tree showed no clear-cut genetic separation of O. nivara and O. rufipogon accessions though, species separation was apparent at the local scale. Nonetheless, Bayesian clustering was able to differentiate the two species in sympatric population pairs across the entire range of their distribution (Banaticla-Hilario et al., 2013a). Furthermore, this study identified a cluster of O. nivara accessions from Nepal that diverged significantly from the other population groups (similar to the findings reported by Kim et al., 2016), as well as two or three other genetically and geographically distinct subpopulations of O. nivara, suggesting that reproductive barriers in this inbreeding group may tend to intensify under sympatric conditions, and that O. nivara may have originated more than once from its perennial ancestor. Local differences in flowering time or in floral and panicle structure associated with the mating system would impact adaptation and have been known to drive reproductive isolation in closely related species (Grillo et al., 2009; Liu et al., 2015). Statistical analysis of the phenotypic data showed 27 of the 32 traits were significantly different between O. rufipogon and O. nivara with spikelet width, anther length, culm length and photoperiod explaining 25.4 percent of the variation between the two species. These studies also noted that Southeast Asian accessions appeared to be more recently diverged and/or had more interspecific gene flow compared to those from South Asia.
To augment our understanding of diversity and population structure in the ORSC and to facilitate the selection of materials for use in plant breeding, we phenotyped the collection genotyped by Kim et al. (2016). Phenotyping was performed at three locations (Los Baños, Philippines, Arkansas, United States and New York, United States) for heritable traits, with emphasis on those commonly used to characterize rice accessions in genebanks (Bioversity International et al., 2007). Several of the traits were associated with differences in life habit and/or mating system and served to substantiate the distinction between O. nivara and O. rufipogon as distinct ecotypes within the ORSC. A significant proportion of ORSC accessions carried unexpected combinations of phenotypes and were associated with admixture from O. sativa.
To enable a more robust interpretation of the phenotypic variation observed, we also merged genotypic datasets for the 286 ORSC accessions analyzed by Kim et al. (2016) and the 446 ORSC accessions analyzed by Huang et al. (2012), Civán et al. (2015), Wang et al. (2017), and Choi and Purugganan (2018) and analyzed the extent of unique or shared variation in each of the studies. Based on these analyses, we identify a set of ‘core accessions’ representing O. rufipogon and O. nivara along with a large group of ORSC accessions that represent unique sources of naturally occurring, highly admixed pre-breeding material for use in plant breeding. This work adds value to the ORSC genetic resources currently conserved in the IRGC and enhances opportunities for expanded utilization in research and plant improvement.
Materials and Methods
Plant Materials and Phenotypic Data Collection
For this study, 240 ORSC accessions from the International Rice Germplasm Collection (IRGC) previously genotyped by Kim et al. (2016), were selected for phenotypic evaluation (Supplementary Table 2). This collection included 102 ORSC accessions from Southeast Asia, 79 accessions from South Asia, 55 accessions from East Asia and four accessions from Australasia. Of these, 222 accessions were evaluated in a screenhouse at the IRRI, Los Baños, Philippines and 130 were evaluated under greenhouse conditions in the United States, with 112 accessions phenotyped in more than one location. At IRRI two plants were grown of each accession with one plant per pot and each pot was considered a single replication. Seed of each accession was planted between June 20 and July 4, 2008, and the plants were phenotyped for the 44 morphological traits related to the vegetative, reproductive and harvest growth stages (Supplementary Table 3). Twenty-two of these 44 traits were measured five times on an individual plant to improve the accuracy of the measurement (Supplementary Table 4).
In the United States, 104 accessions were phenotyped at both Cornell University (CU) in Ithaca, New York and the Dale Bumpers National Rice Research Center (DB) near Stuttgart, Arkansas. Three plants were grown of each accession with one plant per pot and each pot was considered a single replication. At CU, 104 accessions were planted between August 31 and September 8, 2008, and each plant was phenotyped for 16 morphological traits. At DB, 129 ORSC accessions were grown in the greenhouse with three plants per accession, one plant per pot, each pot was considered one replication, and plants were phenotyped for 18 morphological traits. In Arkansas, each accession was phenotyped in two different years, thus a total of six plants were characterized for most accessions. The accessions were planted August 24 to September 6, 2007 (86 accessions); August 1 to September 12, 2008 (124 accessions) and August 12 to 13, 2009 (41 accessions). Supplementary Table 2 lists the location where each accession was grown.
Supplementary Table 3 summarizes the 57 phenotypic traits characterized across the three locations and indicates the location(s) where the trait data were collected. Additional details about the collection of phenotypic data at IRRI are included in Bioversity International et al. (2007). Also listed are the corresponding Planteome acronyms and the trait ontology or crop ontology terms (Cooper et al., 2018). At IRRI, for the 22 quantitative traits with five measurements per plant, the within-plant variances were very small, thus a mean was calculated for subsequent analyses. The replicated trait data collected for each accession by location was used to calculate a best linear unbiased estimator (BLUE) for each trait and accession by location as described in the next section. The BLUEs are listed by location in Supplementary Table 4.
Data Quality
Using the replicated trait measurements taken at each location and a relationship matrix constructed from the GBS genotypes (Kim et al., 2016), we fit multi-trait Bayesian hierarchical models (Greenberg et al., 2011) to the data from each site separately. The model is:
Location parameters of the form yi. are row-vectors of the corresponding parameter matrices that have data points as rows and traits as columns. The overall intercept μwas modeled with a high-variance (I = 106) Gaussian prior. The errors were modeled using a multivariate Student-t distribution with three degrees of freedom to dampen the effects of outliers (Greenberg et al., 2010; Greenberg et al., 2011). We computed the parameters using a C++ program based on an openly-available library3 that implements methods described by Greenberg et al. (2011).
The marker effects enter through the eigenvectors U of the relationship matrix, weighted by square roots of their eigenvalues. We estimated the relationship matrix from all non-singleton SNPs in each data set using the van Raden method (VanRaden, 2008). We used all the eigenvectors that correspond to non-zero eigenvalues. If this regression is performed using a Gaussian prior on the coefficients γj., it is the Bayesian analog of the (matrix-variate) mixed effect model (Kang et al., 2010; Hoffman, 2013). The accession means are analogous to BLUEs. Modes of their posterior distributions were used in the subsequent analyses.
The covariance matrices Σx were modeled using Wishart distributions with weakly-informative Wishart priors with two degrees of freedom for Σe and Σs and four degrees of freedom for Σa (Gelman et al., 2004; Greenberg et al., 2011). This implies a uniform prior on narrow-sense (marker) heritability. Estimated model parameters can then be used to calculate marker heritability:
where Nacc is the number of accessions, and the rest of the notation is as described above. We used the variance of genome-estimated breeding values (GEBV).
rather than values from the marker covariance matrix because the latter reflects the additive covariance only when the prior on the principal component regression (see above) is Gaussian. The values estimate the portion of total genetic variance not explained by genotyped markers. They include the non-additive effects and additive effects not tagged by SNPs. The sum of the GEBV and background variance, divided by total phenotypic variance, is broad-sense heritability (Lynch and Walsh, 1998).
Mixture Model
Using estimates of phenotypic values for each accession, we fit a Gaussian mixture model (Robert, 1996) using a variational Bayes approach (McGrory and Titterington, 2007). The model is
where the notation is the same as for the hierarchical model above and μm⋅ is a row vector of group means. Each group has a separate mean and covariance matrix. The prior population size α is set to a small value, shrinking groups with few members to zero. The number of groups must be set a priori.
We perform inference by running the model multiple times from different starting points and picking the best fit, as assessed using the deviance information criterion (DIC, McGrory and Titterington, 2007). Small DIC values indicate better fit. Our implementation of the model is available as the R package MuGaMix4. We use two methods to assess how many groups are statistically supported: the DIC and the number of groups with at least two accessions. We include the pipeline (implemented in R) that runs the mixture model, processes the results, and generates all the plots and summary tables presented in this manuscript in the Supplementary Material File 1.
Merged Population Structure Analysis
For population structure analysis, the SNP datasets from Kim et al. (2016) and Huang et al. (2012) were merged into a single dataset. First, the Kim et al. (2016) SNPs from ORSC and O. sativa accessions were imputed using Beagle 5.0 (Browning et al., 2018). Next the intersection between the SNPs in the imputed Kim et al. (2016) and the (already imputed) SNPs in the Huang et al. (2012) was determined and a merged file was generated using BCFtools version 1.14 (Danecek et al., 2021). Population structure analysis was done using fastSTRUCTURE version 1.0 (Raj et al., 2014) with K values ranging from 2 to 9.
RFMix Analysis
The local ancestry of the ORSC individuals was determined using RFMix (Maples et al., 2013). The training panel included ten individuals from each subpopulation (W1-W6) with the highest global ancestry as reported by Kim et al. (2016) and included individuals from each of the five O. sativa subpopulations, indica (IND) (10 individuals), aus, (AUS) (9 individuals), temperate japonica (TEJ) (9 individuals), tropical japonica (TRJ) (10 individuals), and aromatic (ARO) (6 individuals). Of the 60 ORSC individuals in the training panel, 49 were phenotyped in the current study. Prior to RFMix analysis, the genotypic data were imputed and phased using Beagle 5.0 (Browning et al., 2018).
Results
Evaluation of Phenotypic Data
Broad-sense and marker heritability distributions for each trait and location are presented in Supplementary Table 5. Heritabilities range from 0.98 to 0.33 and are generally moderate to high. Markers account for at least 33% of total genetic variance across all traits and locations, but it is the generally high H2 that gives confidence in within-site reproducibility of our phenotypic measurements.
Fourteen traits were measured at more than one site. We tested among-site reproducibility of these measurements by estimating correlations among phenotypes evaluated on the same accessions and generally see positive correlations (Supplementary Figure 2 and Supplementary Table 6), again suggesting that phenotypic measurements are reproducible across sites despite the diverse climatic conditions. One notable exception is panicle number (PNNB). Values of this trait are positively correlated between Cornell and Dale Bumpers (temperate and sub-tropical sites, respectively), but both are negatively correlated with IRRI measurements (tropical site), suggesting a genotype by environment interaction.
Inferring Phenotypic Groups
Using estimates of 32 phenotypic values (binary traits were excluded) for each accession in the IRRI data set (n = 222), we fit a Gaussian mixture model (Robert, 1996) using a variational Bayes approach (McGrory and Titterington, 2007). To infer the underlying number of groups that is statistically supported and biologically meaningful, we ran analyses assuming two to 15 groups a priori and assessed model fit (Supplementary Figure 3) using the deviance information criterion and the number of non-empty groups. Both metrics lend statistical support for the division of our accessions into as many as 10 phenotypic groups. However, to make biologically relevant inferences we need a parsimonious classification that is not only statistically significant, but also robust to model uncertainty, reproducible, and interpretable given other biological information. The variational Bayes approach we used is fast but produces only point estimates of parameters. To test robustness of these estimates to initial conditions, we started the model fitting process from five independent sets of initial values. Model fit metrics were consistent across initial value sets (Supplementary Figure 3).
Moving beyond model fit estimates, we tested stability of group membership across model specifications and starting value sets. To anchor these inferences, we started by noting taxonomic classification of our accessions, as found in the IRRI-GRIN-Global database. Based on traditional classification methods, accessions in this database are listed as either O. rufipogon, O. nivara, or, if the taxonomic assignment is uncertain, as Oryza spp. or Oryza hybr. We combined the latter two categories into one, calling it Oryza spp. We tracked each accession, starting from the species designations, across phenotypic groups inferred given different a priori group numbers (NG) using a Sankey plot (Supplementary Figure 4; Kennedy and Sankey, 1898; implemented in the ggsankey R package)5. A line, which is like a ribbon in such plots, represents a single accession, while boxes arranged along the y-axis are groups. Groups derived from models assuming a different number of groups are shown along the x-axis. We can thus follow a given accession as its line connects to each group across models with different NG. If we set NG = 3, the model infers one large group comprising most accessions. The second largest group is composed predominantly of accessions classified as Oryza spp. Increasing the a priori NG to four, we can assign most O. rufipogon and O. nivara accessions to separate groups. If we further increase NG, distinct groups corresponding to the traditional species designations are maintained, with an additional group that comprises most Oryza spp. accessions. However, additional small groups inferred with higher a priori NG do not appear to maintain coherent membership across model runs (Supplementary Figure 4). Thus, while there is statistical support for finer classification, these groupings are not robust to model specification. We therefore focused our analyses on inferences assuming four a priori groups.
Given that models with NG = 4 appear to be the most parsimonious, while still capturing biologically meaningful stratification of the ORSC, we next tested these models for robustness. We started model fitting from 20 sets of initial conditions and averaged posterior probabilities that a given accession belongs to a particular group across runs. We see a set of accessions that reproducibly belong to the P1 or P4 groups (Figure 1A), corresponding to O. rufipogon and O. nivara, respectively. The P3 group has the least reproducible membership. This is because for some initial conditions, a small number of accessions are assigned to it, while for others these lines are placed in P2 (see Supplementary Material 1 for a detailed analysis of these shifts). This may be due to the approximate nature of the variational Bayes inference. Therefore, we added the posterior probabilities of P2 and P3 assignment in subsequent analyses and called the resulting group P2/P3.
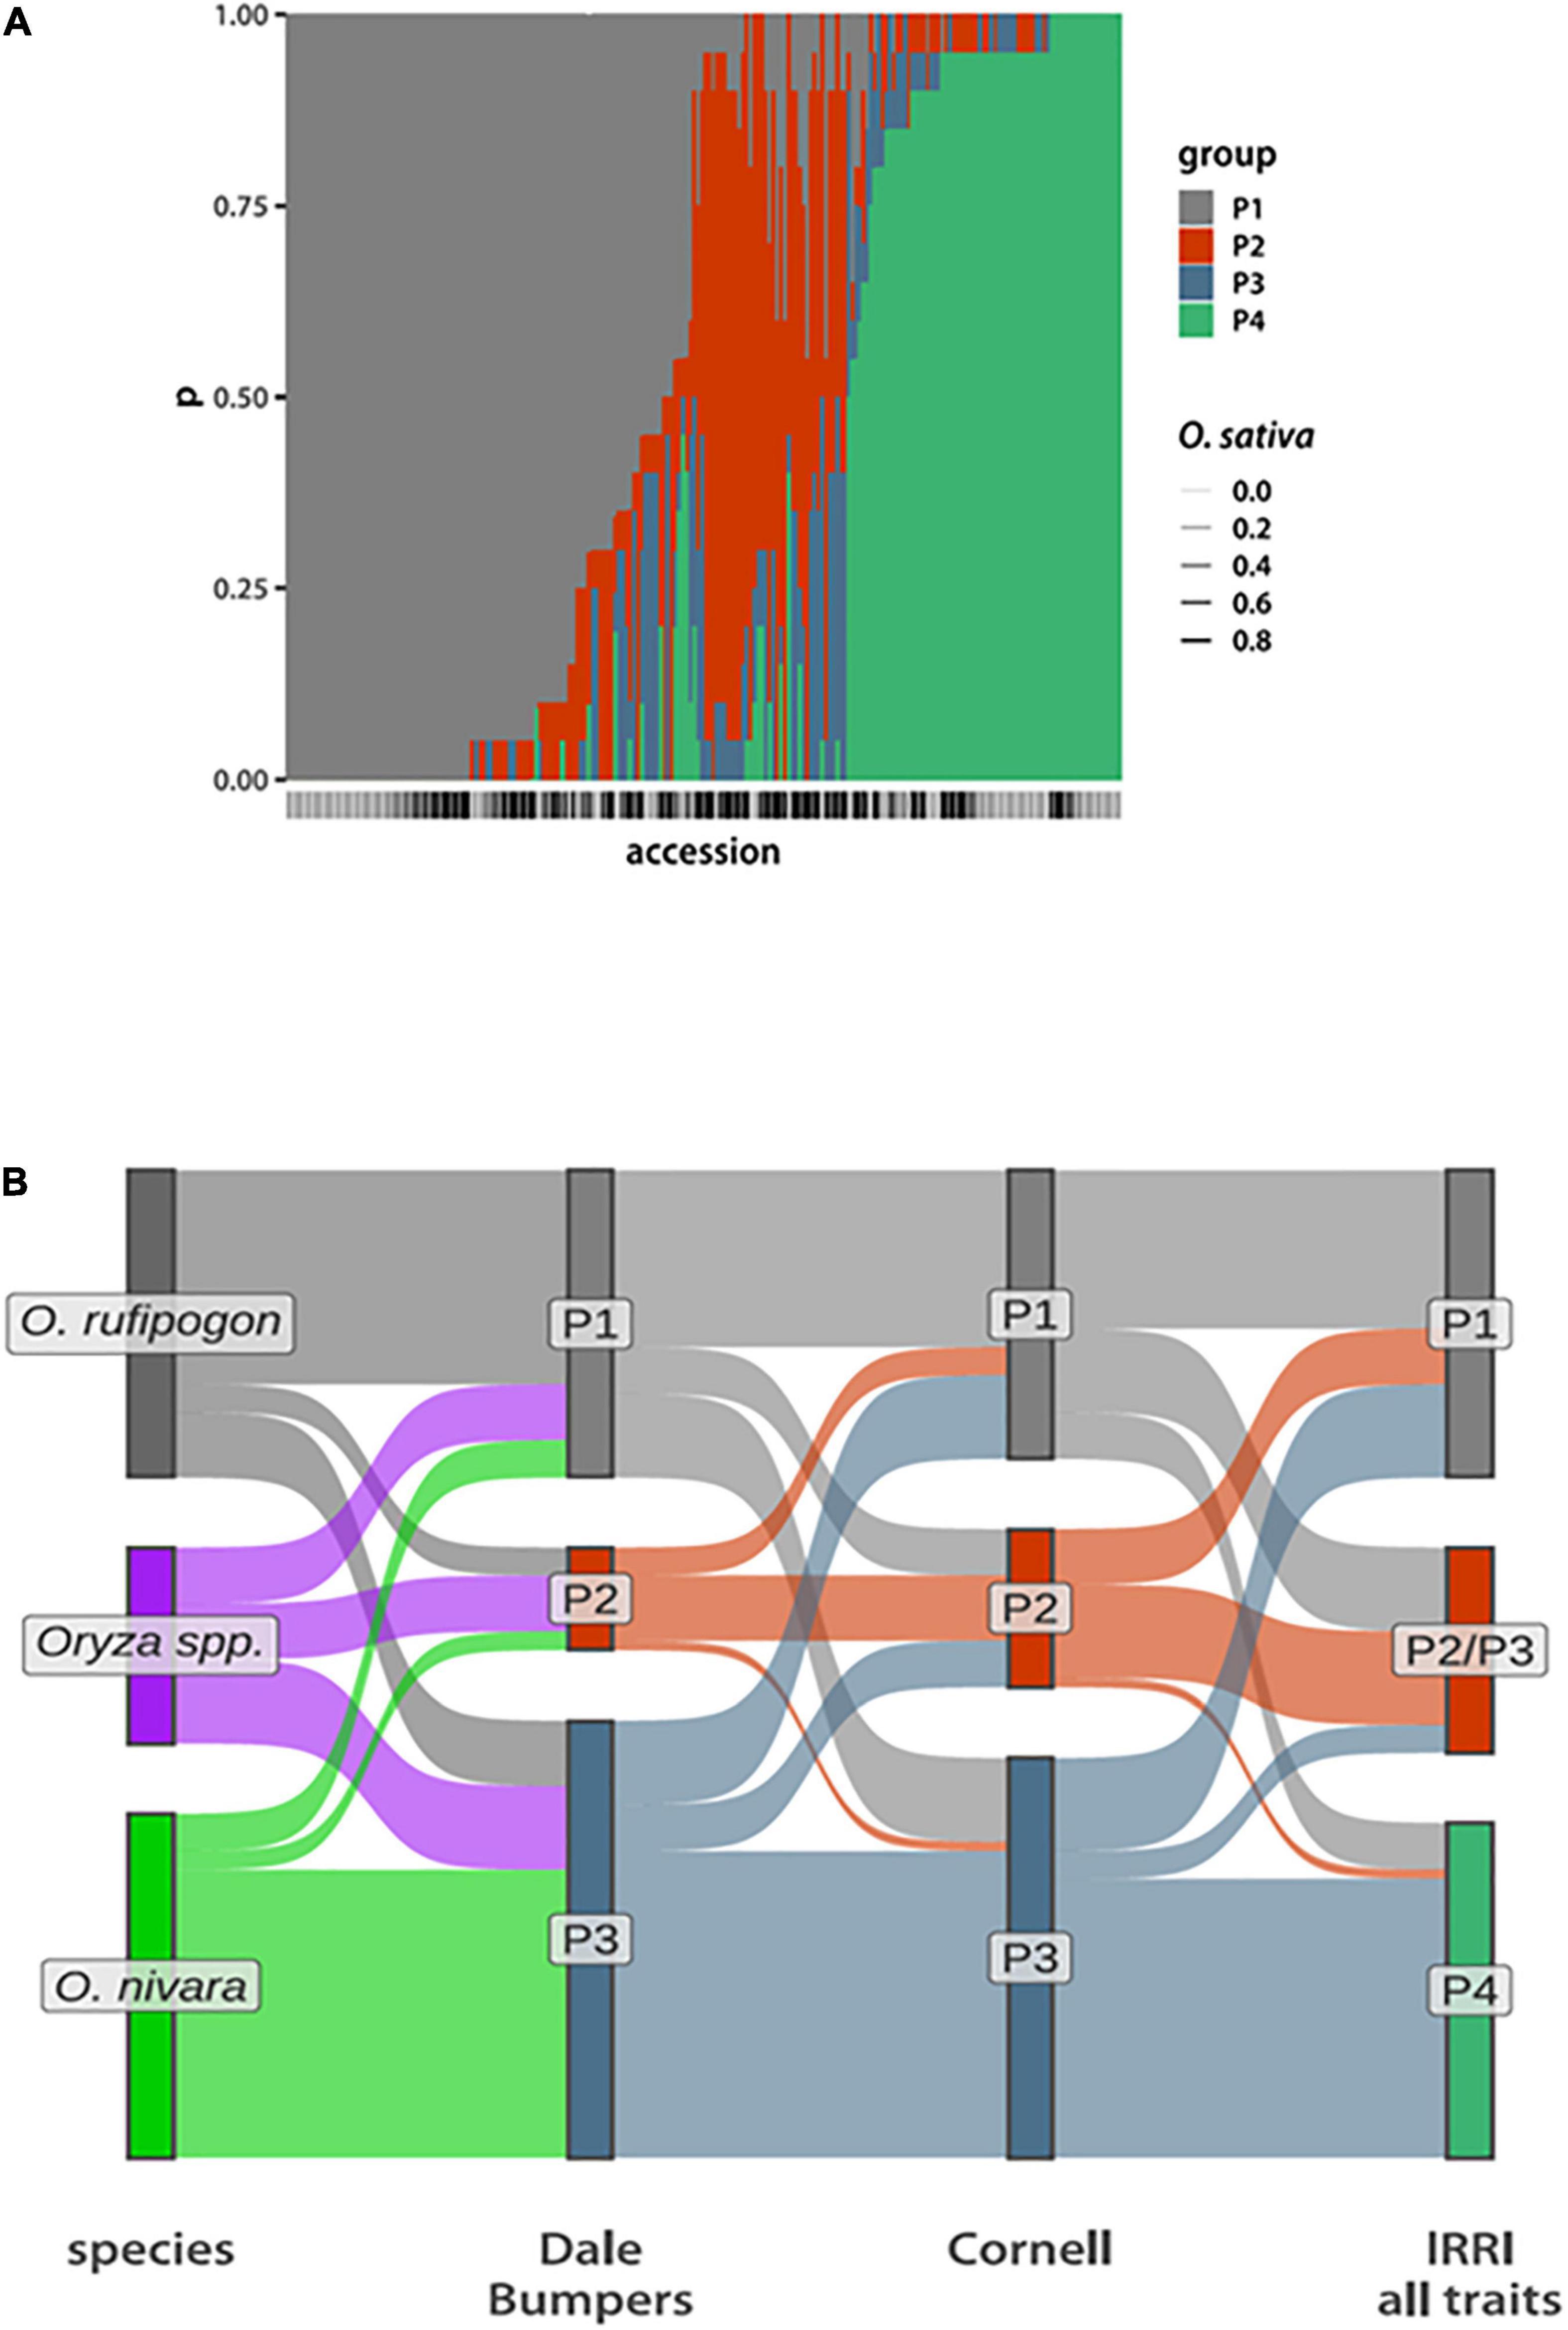
Figure 1. Phenotypic group composition. (A) Bar plot depicting posterior probabilities that a given accession (along the x-axis) belongs to each of the four phenotypic groups. The bars are stacked, with the total probability summing to 1. The bars below the x-axis indicate the O. sativa genome fraction, with the darker bars having a higher O. sativa fraction. (The actual values are in Supplementary Table 2) (B) Sankey plots comparing compositions of phenotypic groups inferred from data collected at Dale Bumpers and Cornell assuming NG = 3 compared to species designations and the four groups inferred from data collected at IRRI. Each accession is a single “ribbon” running from left to right and colored according to the grouping to the left.
The resulting P1 phenotype group contains 106 accessions, of which 82 (78%) are classified as perennial O. rufipogon species. In contrast, P4 has 73 accessions with 43 (59%) classified as O. nivara. About half of the P2/P3 group are designated as Oryza spp. in the IRGC, with the remaining accessions about equally divided between O. nivara and O. rufipogon (Supplementary Figure 5 and Supplementary Table 2).
To further test the reproducibility of phenotypic group inference, we used data collected at DB and CU. These data sets include different, but overlapping, phenotype sets that were measured on fewer than half the accessions represented in the IRRI data (Supplementary Tables 2, 3). Despite this, we can still identify a similar set of three groups (Figure 1B). This time, setting NG = 3 a priori is sufficient to separate O. rufipogon and O. nivara from each other and from a group that largely corresponds to the Oryza spp. designation from IRRI-GRIN-Global. Taking these observations together with the above statistical robustness analyses, we see that a core set of accessions can be reproducibly assigned to a phenotypic group, while inference for others is less certain.
Subsets of Traits Defining Phenotypic Groups
Having established a robust phenotype-driven grouping of ORSC accessions, we next wanted to define a minimal combination of phenotypic traits that is sufficient to reproduce these divisions. Our mixture model allows both phenotype means and covariance to vary among groups. We started by ranking traits according to how well their values correlate with our groups (Figure 2A). We used a multivariate regression with group identity probabilities as the response variable and trait values as predictors. Since the last group membership is fully determined by the other three, only P1 and the combined P2 and P3 membership probabilities were used. We estimated regression coefficients and their covariance and used them to calculate a Hotelling T2 statistic (Hotelling, 1931) of each trait-group association. This is a multivariate version of the square of Student’s t statistic widely used to determine statistical significance of individual regression coefficients. However, in this case we were not interested in the significance of associations. Instead, we ranked traits by their T2 values (Figure 2A). Two traits, culm length (CULT) and number of empty spikelets per panicle (UNFILLED), stand out for their association with phenotypic groups. Their Hotelling T2 statistics (0.71 for CULT and 0.70 for UNFILLED) are over twice the value of the next seven highest trait-group associations for which T2 ranges from 0.17 to 0.28 (Table 1 and Supplementary Table 7). Accessions belonging to the P1 group are on average taller, with P4 the shortest and P2/P3 intermediate. P2/P3 accessions typically have the most empty spikelets per panicle, while P4 accessions have the least (Supplementary Figure 6).
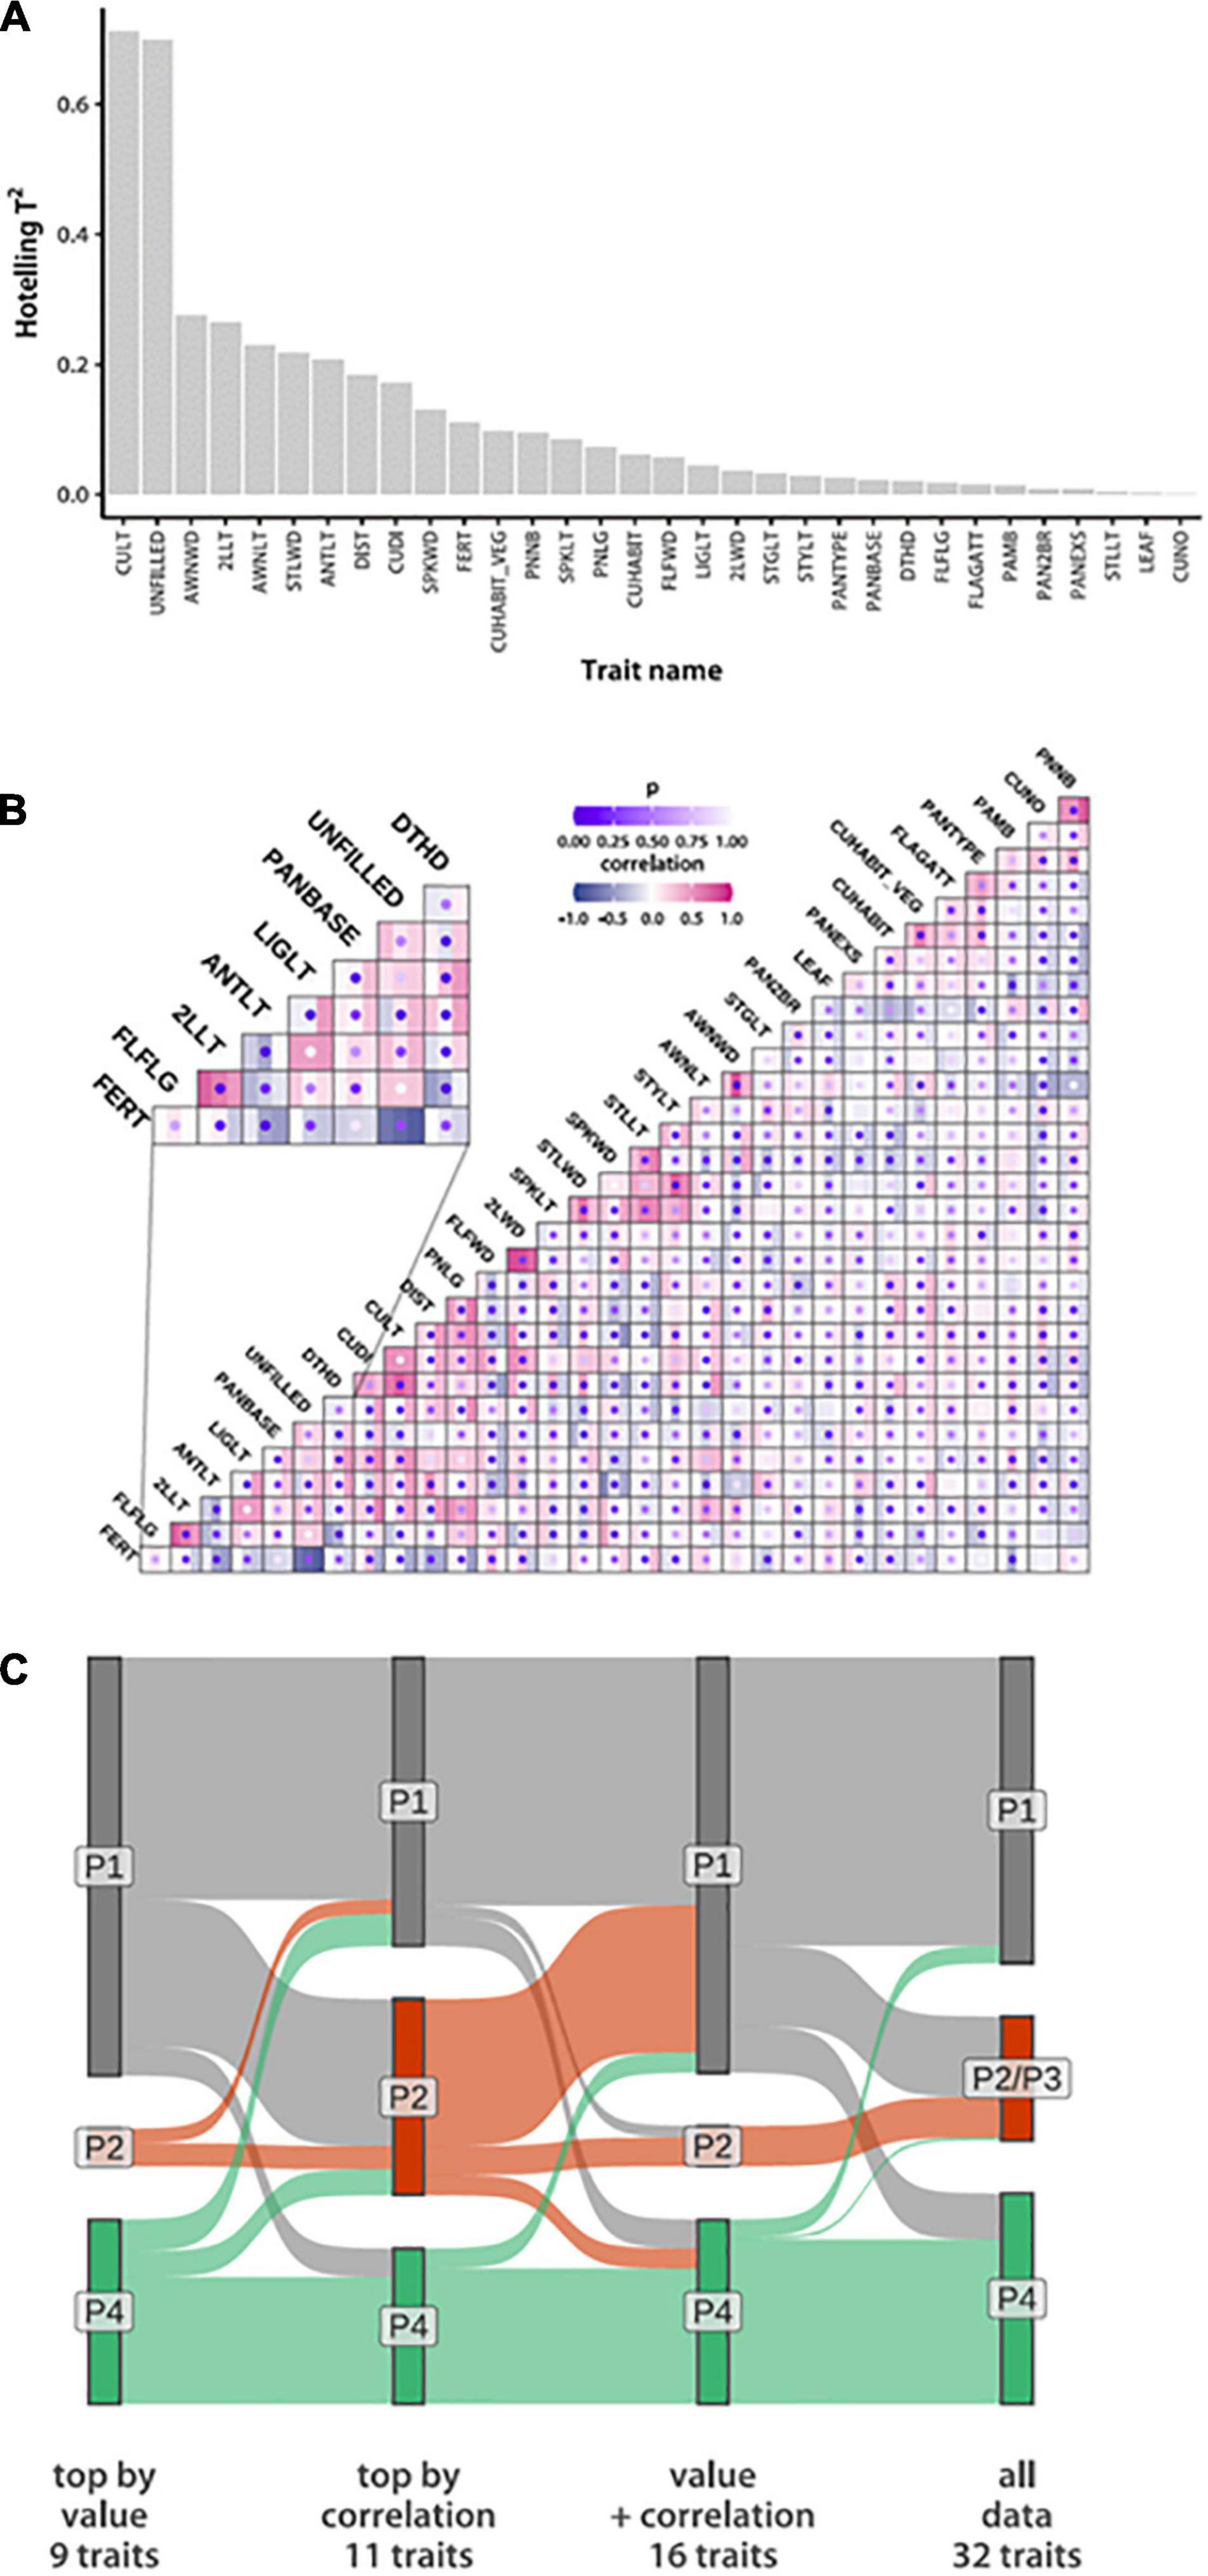
Figure 2. Phenotypic identifiers of group divergence based on the IRRI data. (A) Traits sorted by the strength of the association of their values to NG = 4 group assignments based on Hotelling T2 values (B) Among-trait correlation estimates within each phenotypic group. Squares mark trait pairs, with the three bars within each square colored according to correlation magnitude in the three phenotypic groups. Dots represent probabilities of observing the correlation differences by chance (lower probabilities reflect high confidence of correlation difference). The inset shows a segment of the plot in more detail. (Trait acronyms and actual values are in Supplementary Table 7) (C) Sankey plot comparing accession membership across groups inferred from trait subsets listed in Table 1.
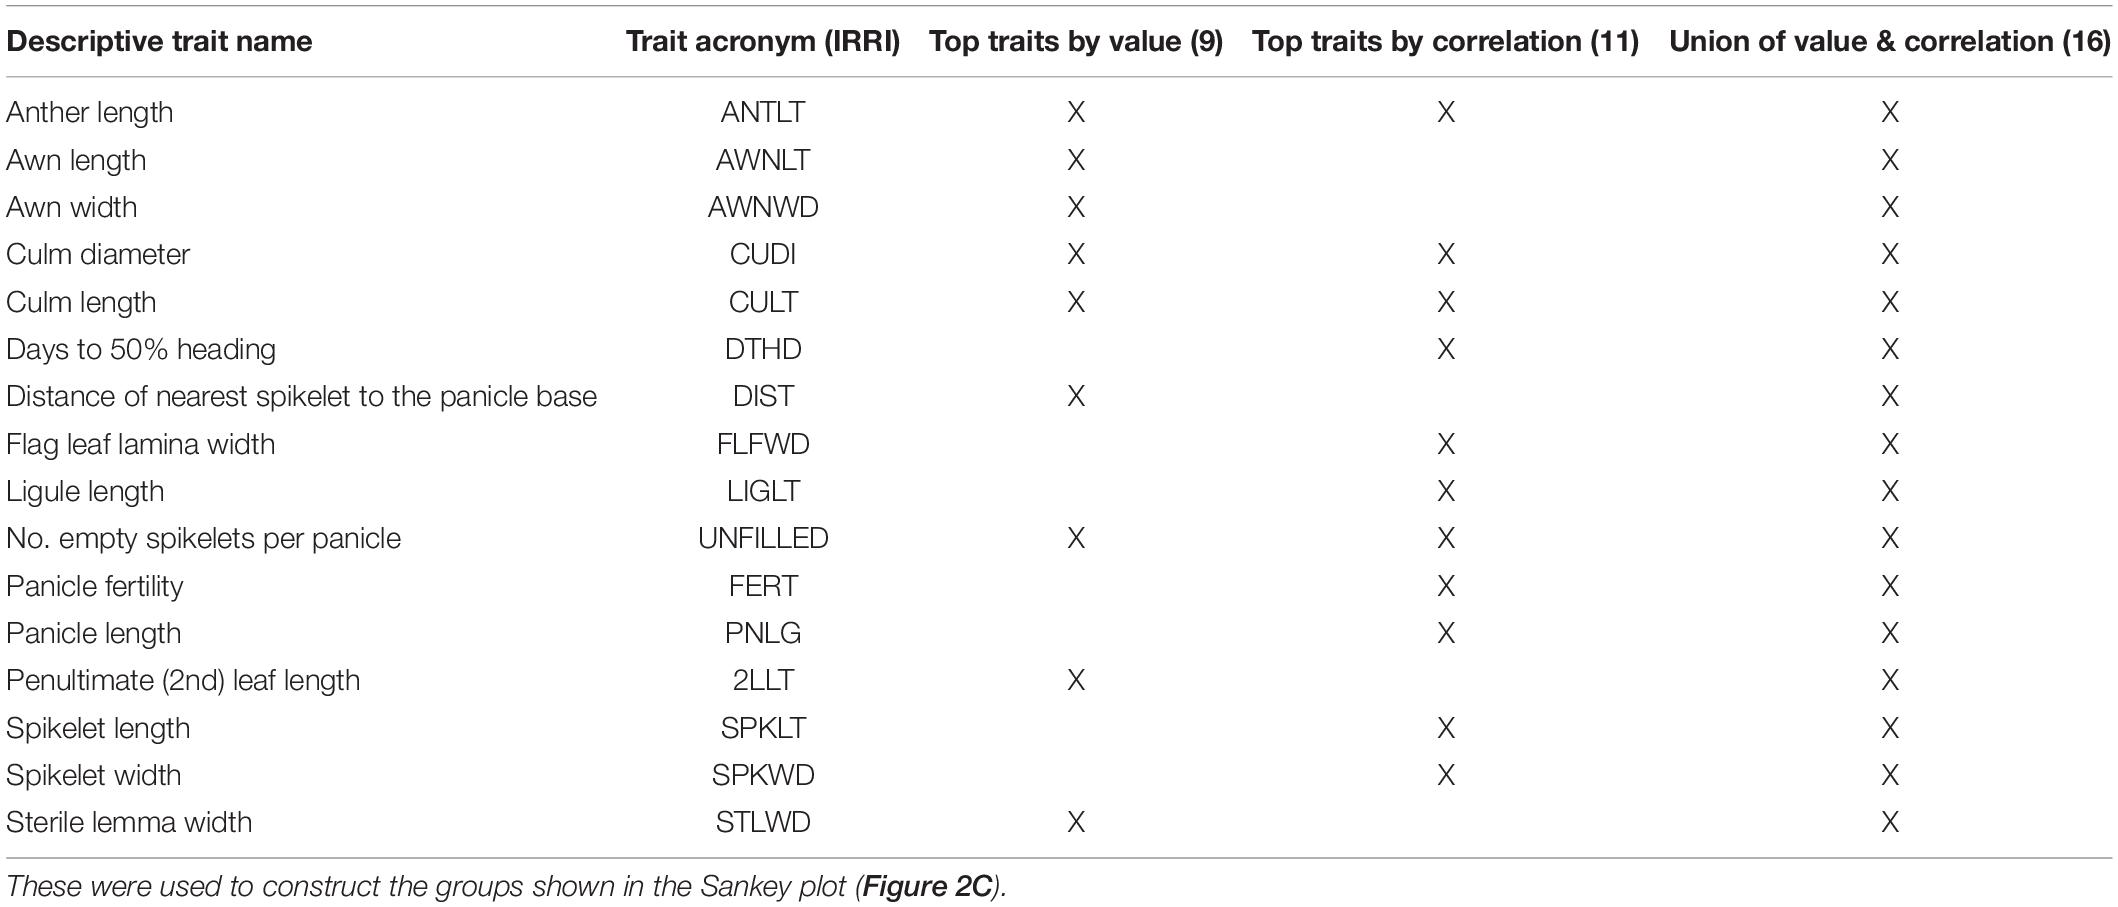
Table 1. Phenotypic traits identified by trait value (9 traits), correlation switching (11 traits) and the union of both sets of traits (16 traits) based on the analysis of the phenotypic trait data collected at IRRI.
To find pairs of traits that change correlations across groups, we first estimated within-group associations and then used a permutation test (randomly assigning accessions to groups) to assess statistical evidence for across-group variation (Figure 2B). The most significant correlation changes occur between the number of empty spikelets (UNFILLED) and either panicle length (PNLG) or culm diameter (CUDI). These correlations are positive (0.54 and 0.48, respectively) only in P4 (Supplementary Table 7).
To test if subsets of traits can reproduce our phenotypic groups, we took 11 traits that belong to pairs that change correlations with probability at least 0.001 (Table 1). This set also includes the top two traits (CULT and UNFILLED) whose values correlate best with group assignments. To expand the trait subset, we added seven phenotypes with T2 > 0.17. Hotelling values showed a marked drop below this cut-off. These two sets have four traits in common [CULT, UNFILLED, CUDI, and anther length (ANTLT)]. We also used the union of the two sets, containing 16 traits, or half the number in the full data set. Although covariance matrices include both correlations and variances, all traits with appreciable among-group variance changes are already accounted for by using correlation and mean differences (Supplementary Figures 6, 7).
We used three data subsets (nine traits associated with phenotypic groups by value only, 11 that switch correlations, and 16 that were associated either by value or correlation) to re-fit our mixture model, setting the a priori number of groups at three. We ran our analyses 20 times and averaged posterior probabilities of accessions belonging to each group. Using all three data sets, we consistently see three groups that separate O. rufipogon from O. nivara. The nine- and 16-trait data sets assign most P2/P3 accessions to P1 (Figure 2C). The 11 traits most likely to change correlations across groups appear to be sufficient to recapitulate the grouping inferred from the whole data set. The two traits, CULT and UNFILLED, most closely aligned with groups by value and are included in this collection.
Our approach identified a minimally sufficient set of traits that captures most of the phenotypic group structure in the IRRI data. This does not mean that other sets of traits could not achieve similar results but an exhaustive search for all possible combinations that could achieve the same result was not undertaken considering time and the computational expense. Instead, we pursued two approaches using the Cornell and Dale Bumpers data sets to find alternative sets of traits that could be used to re-infer the three major phenotypic groups identified using the full data set. First, we used the process outlined above to identify traits associated with the phenotypic groups that were inferred from IRRI data by value or that change correlations with other traits. Supplementary Figures 8, 9 visualize the Dale Bumpers data analyses and Supplementary Figures 10, 11 visualize the Cornell data analyses with the actual values in Supplementary Table 7. This approach did not identify additional trait subsets that could reliably identify phenotypic groups (Supplementary Figures 12A,C). Second, we identified traits evaluated at Dale Bumpers and Cornell that are the same or similar to the 11 phenotypes (Supplementary Table 3) that defined the grouping patterns in the IRRI data. Re-running our mixture model with these analogous traits reproduced the original groups, albeit at lower resolution (Supplementary Figures 12B,D). Using fewer than 11 traits thus appears to significantly degrade group assignment precision and reproducibility.
Relationships Between Phenotypic Groups and Genetic Subpopulations
While our phenotypic groups largely correspond to IRRI-GRIN-Global species designations, we wanted to know how the groups related to previously characterized genotypic subpopulations. The accessions used in this study were genotyped by Kim et al. (2016) who reported six ORSC subpopulations (W1-W6). Based on RFMix (Maples et al., 2013) analysis, we identified introgressions among ORSC subpopulations and between the ORSC and five O. sativa subpopulations (IND, AUS, TRJ, TEJ, ARO). We partitioned accessions with more than half of their genome introgressed from O. sativa into a separate “admixture with O. sativa” group (ADM/OSAT). By means of a Sankey plot, we related the species designation, phenotypic group and genetic subpopulation for the ORSC accessions with complete information (Figure 3A and Supplementary Table 2). Across the ORSC subpopulations, the majority of the W1, all W3, and about half of the W6 accessions (as per Kim et al., 2016) clustered in the P1 group, taxonomically designated as O. rufipogon. Conversely, all of the W5 accessions and most of the W2 clustered in the P4 group, taxonomically designated as O. nivara. Finally, accessions with significant O. sativa introgression fell almost exclusively into the P2/P3 group and are classified as Oryza spp. The P2/P3 group identified using the reduced set of 11 traits also includes most of the W6 subpopulation (Supplementary Figure 13). Eight accessions taxonomically classified as O. rufipogon in the IRGC were genetically designated as W2 or W4 by Kim et al. (2016) and clustered with the P4 group in this study. These accessions had less than 20% of their genome from O. sativa and were re-classified as O. nivara in our analyses (including in the results reported above) and are identified in Supplementary Table 2.
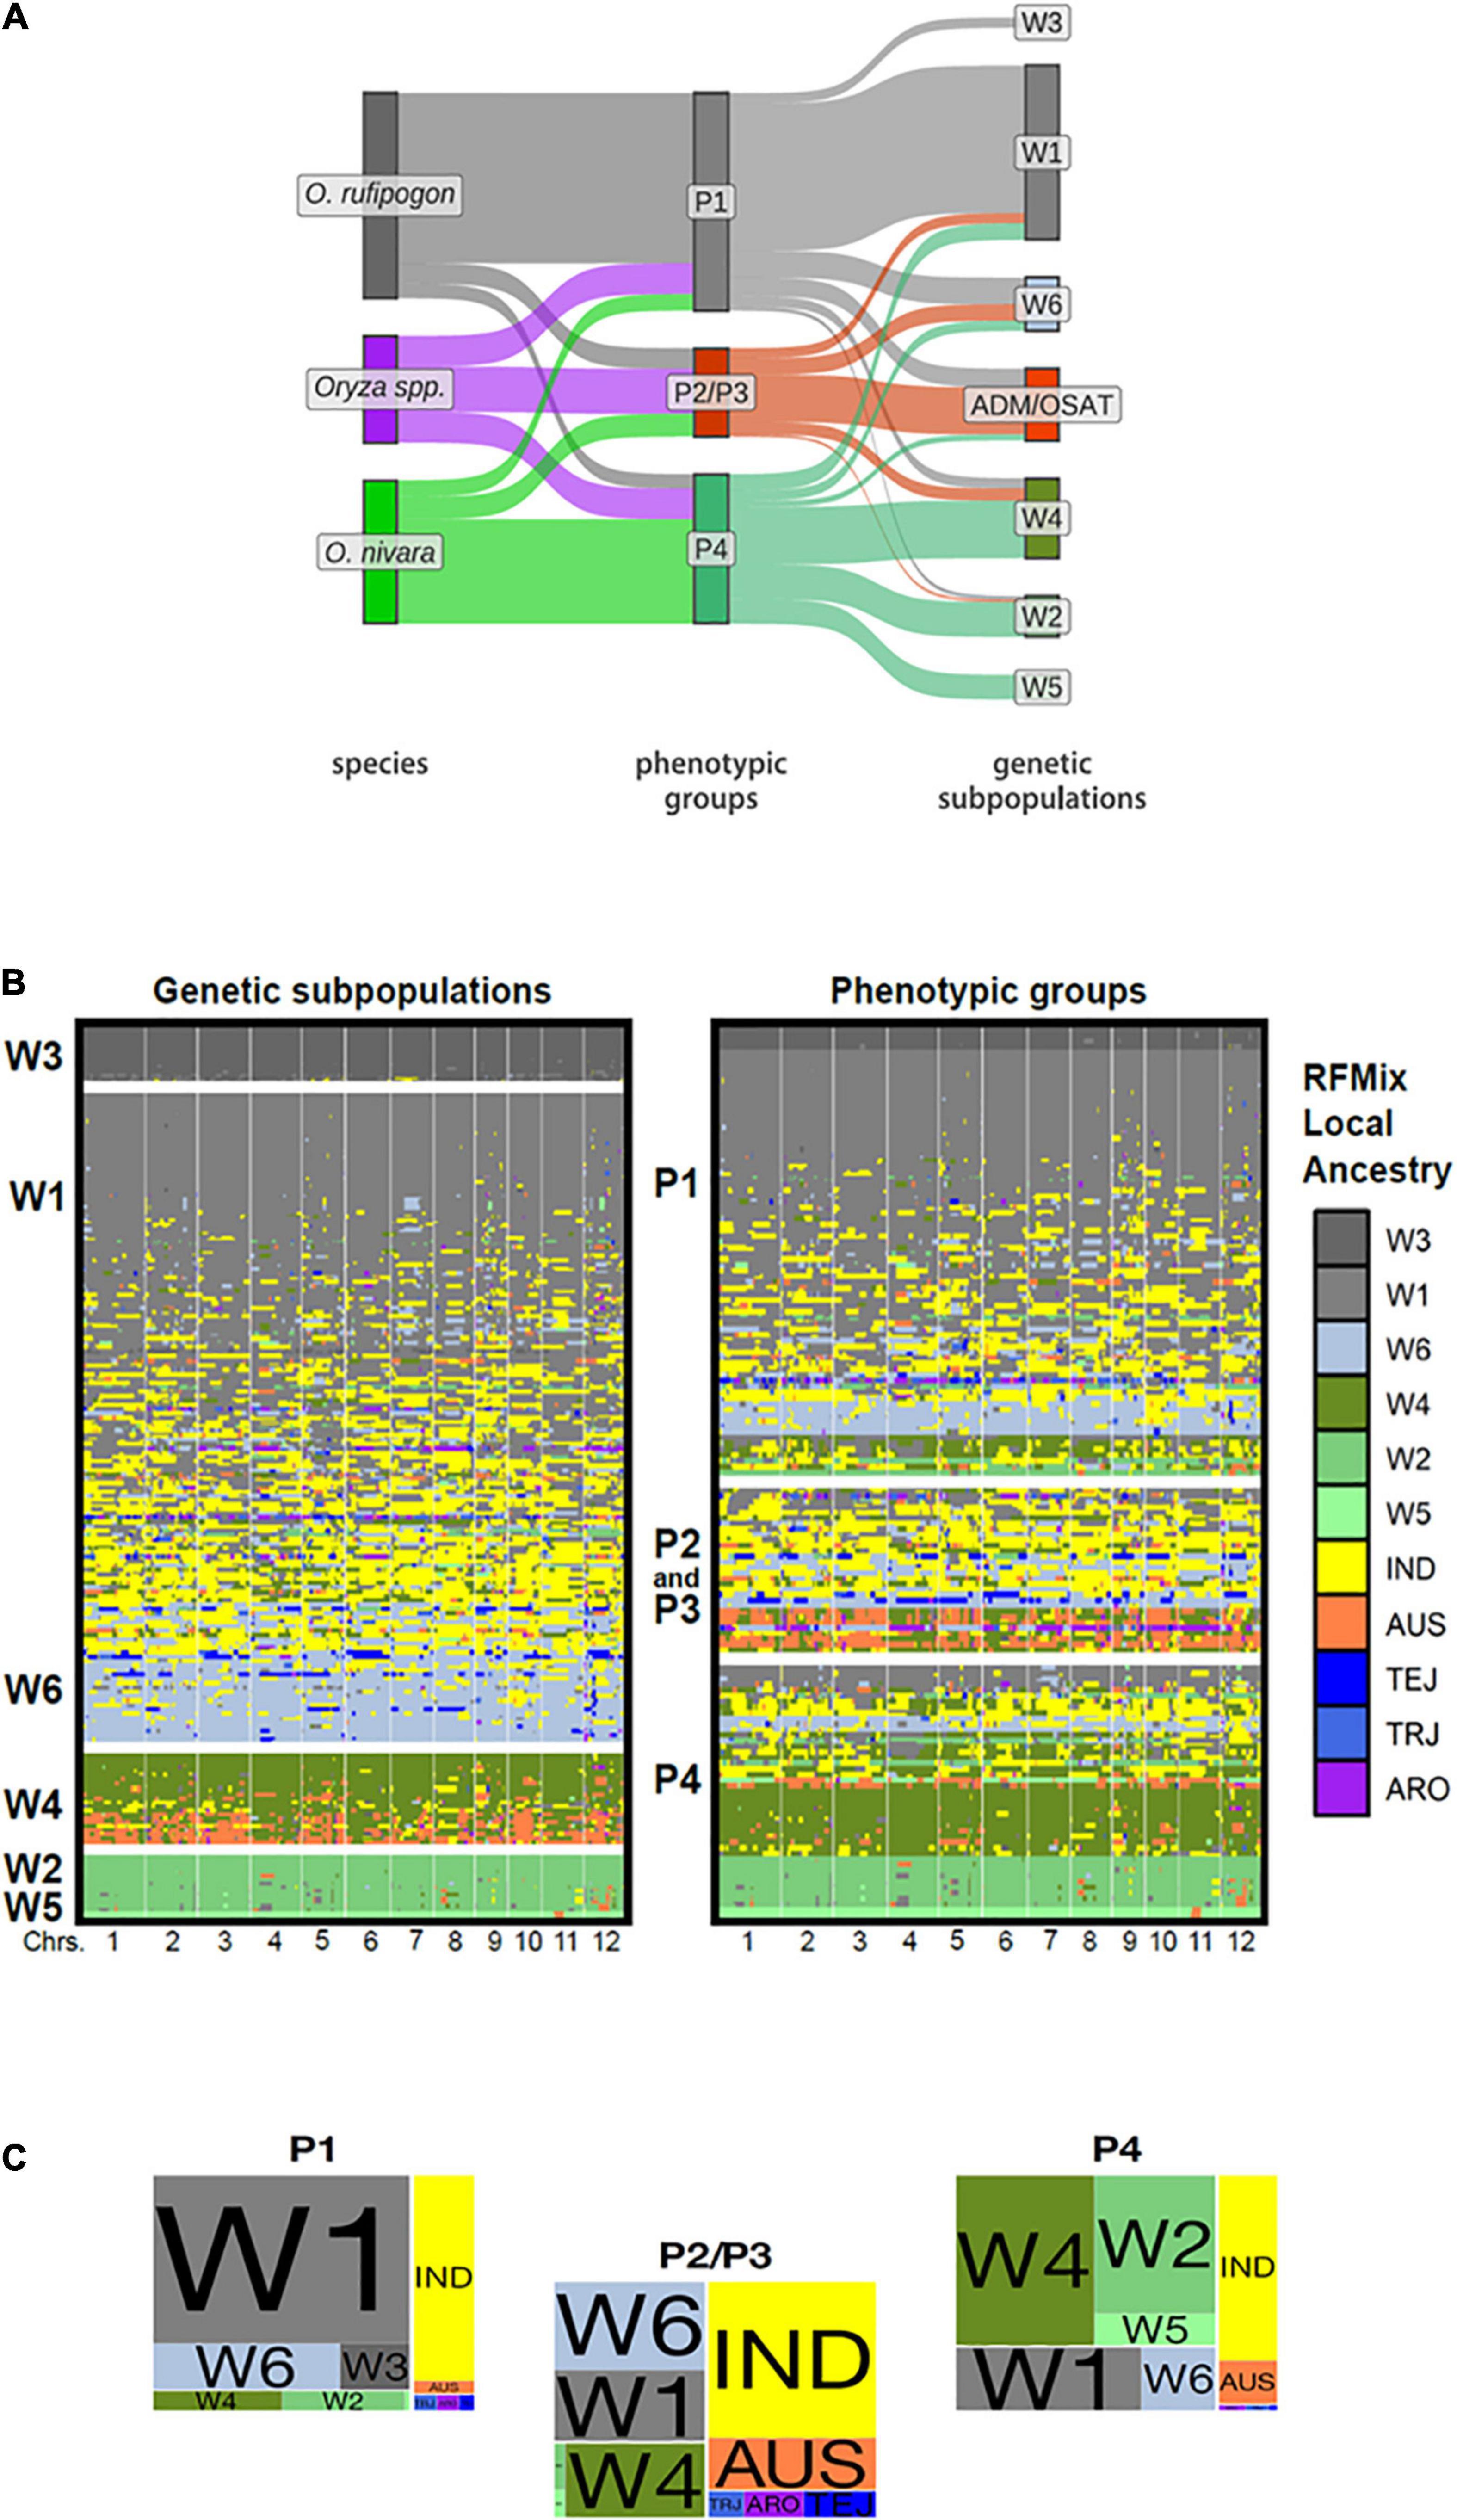
Figure 3. Genotypic composition, local ancestry and phenotypic groups of ORSC accessions. (A) Sankey plot depicting correspondence between traditional species designations, our phenotypic groups, and Kim et al. (2016) genetic subpopulations using 32 phenotypic traits. (ADM/OSAT are accessions with a high proportion of admixture with O. sativa) (B) Graphical genotypes display the local ancestry of each ORSC individual as determined by RFMix trained on six ORSC subpopulations (W1-W6) and five O. sativa subpopulations: indica (IND), aus, (AUS), temperate japonica (TEJ), tropical japonica (TRJ), and aromatic (ARO). The accessions are arranged according to global genotypic ancestry (left) and phenotypic group assignment (right). Each individual’s genotype is represented by two adjoining rows corresponding to phased haplotypes with colors indicating RFMix population assignments of chromosome segments (C) Proportion of the ORSC subpopulations (left) and O. sativa subpopulations (right) within each of the three phenotypic classes.
Surveying the individual introgressions across the genome, there were no obvious patterns identifying particular genomic regions underlying the phenotypic group differentiation (Figure 3B). This result was not surprising, given that these groups are distinguished by multiple polygenic traits. We do see that those accessions from the P2/P3 group were more likely to harbor O. sativa introgressions (Figures 3B,C) and the median portion of the genome coming from O. sativa is also larger in P2/P3 than in P1 or P4 accessions (Supplementary Figures 14B, 15). However, P1 and to a lesser extent P4 harbor a few accessions with significant contributions from O. sativa or ORSC subpopulations typically associated with a different phenotypic group, suggesting that similar phenotypic syndromes can be achieved through divergent genotypes.
Most O. sativa introgressions come from the indica subpopulation (Figure 3 and Supplementary Figure 14B). Only accessions belonging to the P2/P3 group show appreciable contributions from O. sativa japonica. Introgressions from aus are relatively more prevalent in accessions from both P2/P3 and P4.
Genomic Analysis of Merged ORSC Datasets and Geographic Distribution
To compare the population structure of the collection of ORSC analyzed by Kim et al. (2016) (n = 286) with that generated by Huang et al. (2012) and subsequently analyzed by Wang et al. (2017) (n = 435), a merged SNP dataset was constructed and analyzed using fastSTRUCTURE (Raj et al., 2014). The combined dataset contained 55,213 SNPs shared between them. Structure analysis of the merged data resulted in six subpopulations that match nearly perfectly with the six subpopulations reported by Wang et al. (2017), (Figure 4A). The six subpopulations, designated W1 to W6 by Kim et al. (2016) have a clear connection to those designated Or-A to Or-F by Wang et al. (2017) as illustrated by shared merged groups. The main differences are due to the thresholds used to classify accessions designated as admixed, and the different size and composition of the two collections. Where Wang et al. (2017) used a threshold of > 80% ancestry to classify accessions as belonging to one of the wild groups, Kim et al. (2016) used a threshold of >60%. As a result, roughly half of the accessions designated as W1 by Kim et al. (2016) were identified as admixed in the combined analysis. It is also noteworthy that Kim et al. (2016) had a smaller proportion of wild accessions from China (W6), and a larger proportion from Papua, New Guinea (W3) and from Nepal (W5), which impacted the subpopulation structure that emerged in the analysis. Nonetheless, there is a clear correspondence between genetic groups in the two studies, with W1 and W3 (predominantly O. rufipogon as described by Kim et al., 2016) corresponding to Or-A (Wang et al., 2017), W6 (Chinese O. rufipogon) to Or-B, and W2 (predominantly O. nivara) to Or-C. W4 (aus-like wild ancestor as described by Kim et al., 2016) is split between Or-D (wild) and Or-E (feral), and interestingly, the accessions clustered as Or-E by Wang et al. (2017) were recognized as a separate group by Kim et al. (2016) when a higher K value (K = 8) was used in the analysis.
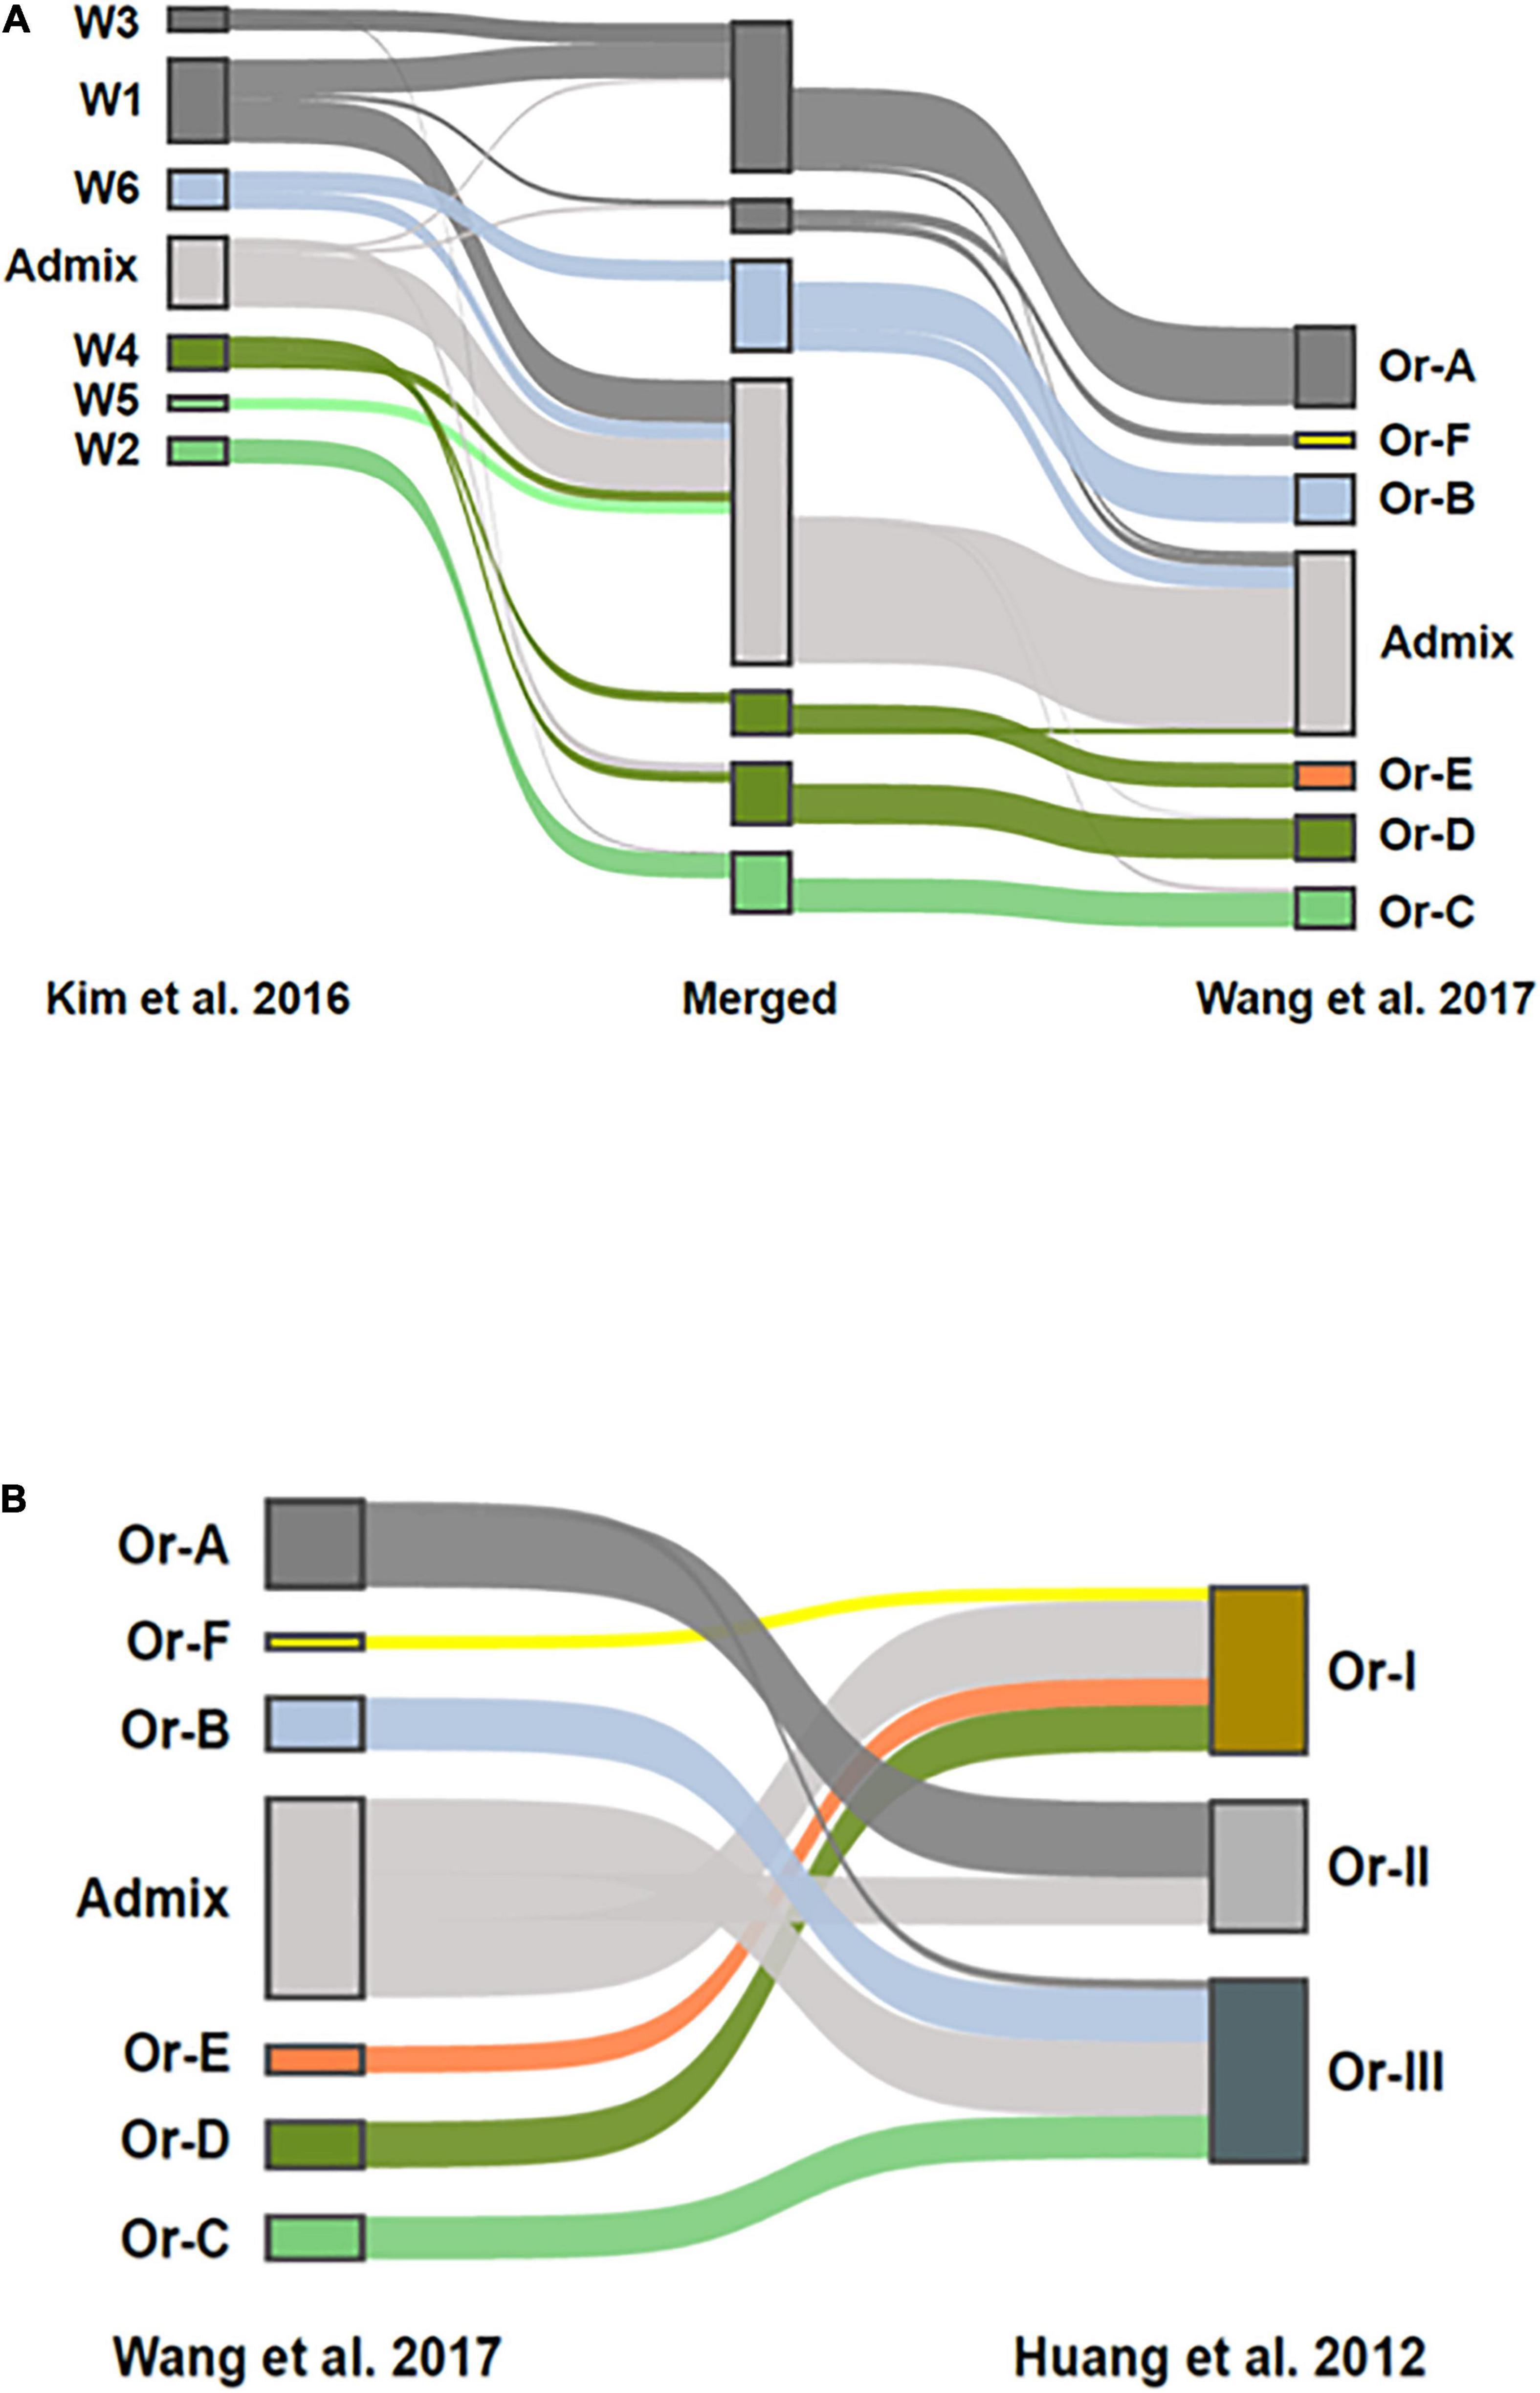
Figure 4. Comparison of ORSC genotypic subpopulations reported by Kim et al. (2016) based on 286 ORSC accessions to those reported by Wang et al. (2017) and Huang et al. (2012) based on 446 ORSC accessions. (A) Population structure assignments in a merged SNP dataset consisting of accessions from two ORSC collections. On the left side are the accessions from Kim et al. (2016), on the right are accessions from the analysis by Wang et al. (2017). In the center is a merged set with group assignments at K = 7. Ribbons connect the group assignments of the merged accessions with their group assignments in the respective ORSC collections (B) Comparison of the three subpopulations originally identified by Huang et al. (2012) to the six subpopulations and admixed group identified by Wang et al. (2017) when reanalyzing the same genotypic data. The inclusion of aus-like (Or-E) and indica-like (Or-F) accessions in Or-I and japonica-like (Or-B) accessions in Or-III as reported by Huang et al. (2012) is confirmed.
The groups identified by Wang et al. (2017) also show reasonable correspondence to the original three groups proposed by Huang et al. (2012), (Figure 4B), though Huang et al. (2012) did not explicitly call out the large proportion of ORSC accessions that are highly admixed with O. sativa as both Wang et al. (2017) and Kim et al. (2016) did. Given the different compositions of the two germplasm collections, this merged genomic analysis allows us to interpret our findings about the three phenotypic groups in a larger context.
There is support for geographic subpopulation structure whereby accessions collected from the Malay Archipelago (Malaysia, Indonesia, Philippines, Papua New Guinea), which represents the southeastern extreme of the geographic distribution of the ORSC, are phenotypically classified as P1 in this study; they are also predominantly classified as O. rufipogon in the IRGC (Supplementary Figure 16). Accessions from India, Nepal, and Sri Lanka, representing the northwestern extreme of the geographic distribution, are predominantly classified as P4 in this study and O. nivara in the IRGC. Accessions collected from China were genetically classified as O. rufipogon with substantial admixture from O. sativa (Kim et al., 2016), but they were phenotypically more similar to annual O. nivara in this study. Accessions collected across the coastal regions of South and Southeast Asia are recognized phenotypically as P2/P3 and are typically the most highly admixed with O. sativa. A great diversity of phenotypic variation is found in mainland Southeast Asia where ORSC accessions manifesting both P1 and P4 phenotypic syndromes co-exist, often sympatrically or in contiguous environments. These geographical distributions of O. rufipogon and O. nivara are clearly shown in Supplementary Figure 16B where only the locations of the “core” accessions, those for which the species, phenotypic group and genotypic subpopulation agreed, are shown. The fact that cultivated forms of rice, predominantly representing the indica subpopulation, overlap with wild rice habitats in many parts of Asia creates endless possibilities for cross fertilization and the emergence of novel phenotypes. In addition to their inherent value and interest, these naturally occurring interspecific populations represent valuable, ecologically viable pools of variation for plant breeders interested in identifying novel forms of climate resilience for crop improvement.
Discussion
Trait Significance
The traits measured in this study emphasize highly heritable, easily measured morphological and physiological traits that can be readily observed in populations of crop wild relatives grown under controlled conditions. Many of the same traits are evaluated by genebanks and widely used for identification, tracking and management of ex situ germplasm collections. Of the traits measured here, four were significantly associated with phenotypic groups and with life history; these included days to heading, plant height, percent filled spikelets per panicle (seeds/panicle), and spikelet/seed size (related to grain weight). These traits provided information that was valuable for differentiating annual and perennial life habits and were similar to traits evaluated by Grillo et al. (2009) in two O. rufipogon/O. nivara mapping populations. We also measured several traits that were potentially informative about mating habit, including anther length, style length and stigma length, but only anther length discriminated the groups based on both Hotelling T2 value and correlation estimates (Table 1). These traits related to life history and mating habit support our understanding of the biological significance of our phenotypic groups.
Traits That Differentiate Phenotypic Groups
The single most informative trait for distinguishing ORSC phenotypic groups based on the Hotelling T2 values across all three datasets was seed width (HULGRWD) (T2 value = 1.15) measured at Dale Bumpers, which served as a proxy for spikelet width (SPKWD) measured at IRRI, and seed volume, (T2 value = 1.70) calculated from seed width and length. Spikelet width and seed width were highly correlated (r = 0.62) and both width and volume were informative for distinguishing groups. Seed traits were not measured at Cornell and therefore could not be used for further confirmation.
Comparing this analysis to the principle component analysis (PCA) of phenotypic data collected at IRRI on a different set of 116 ORSC accessions, Banaticla-Hilario et al. (2013a) also reported SPKWD as one of the most important characters separating O. nivara and O. rufipogon accessions. The other important traits included anther length (ANTLT), days to heading (DTHD) and culm length (CULT). Of note, spikelet fertility was not included in the PCA because it was highly correlated with anther length and spikelet width, leading to the conclusion that anther length and spikelet width serve as a proxy for fertility when plants are grown under controlled screenhouse conditions. Our data on DTHD collected at IRRI differentiated P1 from the other groups. The trend is the same in the Cornell and the Dale Bumpers data, but with more overlap between groups. This may be a consequence of evaluating DTHD during the short days of fall at higher latitudes. Across our three environments, unfilled grain number (UNFILGRNB) in the IRRI and Dale Bumpers data and seed weight (Seed_S2) collected from bagged and unbagged panicles at Cornell provided useful proxies for spikelet fertility. Lastly, culm length (CULT) which was measured from the soil surface to the panicle base at IRRI and plant height (PTHT) measured from the soil surface to the tip (end) of the panicle at Dale Bumpers and Cornell were prominent differentiators across all three studies. This comparison confirms that many traits distinguishing the phenotypic groups can be identified across different environments and panels of ORSC accessions. These observations are confirmed by earlier studies summarized in Supplementary Table 1 in which O. nivara was characterized by having wider seeds, higher seed production (fertility), shorter culm length (plant height), and earlier flowering (due to photoperiod insensitivity) compared to O. rufipogon which was characterized by relatively narrow seeds, low seed production, longer culm length (taller plant) and later flowering (due to photoperiod sensitivity) (Morishima et al., 1961; Oka and Morishima, 1967; Barbier, 1989a).
Considering the high information content of SPKWD (spikelet/seed width) as a distinguishing feature of the phenotypic groups identified in this study and its utility for differentiating the O. rufipogon and O. nivara species, we recommend including seed width and length in the suite of traits collected on ORSC accessions in genebanks around the world. With the availability of scanners and appropriate software, this would be an inexpensive investment that would help improve the classification of ORSC accessions, making collections of these crop wild relatives more valuable to users.
“Core” Oryza rufipogon and Oryza nivara Accessions and Admixture With Oryza sativa
Of the ORSC accessions phenotyped in this study, approximately 41% (∼98 accessions, including the 49 extracted for use as training sets) had less than 5% introgression from O. sativa and can be considered non-admixed and wild. Most of these (n = 91) clustered in either P1 (n = 48) where most were classified as O. rufipogon or in P4 (n = 43) where most were classified as O. nivara, while a few (n = 7) clustered in P2/P3.
Based on analyses of both phenotypic and genotypic data using different model parameters, we identified 42 “core” accessions that are consistently classified as perennial O. rufipogon and 25 “core” accessions consistently classified as annual O. nivara. These “core” accessions all have <20% admixture from O. sativa and intersect with the group carrying <5% O. sativa introgression. This collection of 67 accessions provides a useful subset of ORSC materials for studying the genetic basis of the phenotypic divergence that distinguishes the two ecotypes of wild rice in Asia.
ORSC accessions that are highly admixed with O. sativa are also of interest. In this study, 25% of accessions were classified as admixed because they had >40% of the genome introgressed from O. sativa. In the previous study by Wang et al. (2017) using a different panel of ORSC accessions and a different threshold for determining admixture, 42% of wild rice samples were reported to be substantially admixed with >20% of the genome showing introgression from O. sativa. In both studies, indica and aus introgressions accounted for the largest proportion, and japonica introgressions were rare. Admixed accessions found in P1 and P4 in this study had an average of 19.8% and 19.0% of their genomes comprised of introgressions from O. sativa, respectively, while levels of admixture in P2/P3 averaged 52.6%; indeed, two P2/P3 accessions carried ∼85% O. sativa DNA (Figure 3C and Supplementary Figure 15). Nonetheless, the genome-wide level of admixture alone, is not a good predictor of phenotype, given that 13 accessions classified phenotypically into P1 carry > 40% O. sativa DNA, and 9 accessions classified phenotypically as P4 carry > 40% O. sativa DNA. We therefore infer that it is the particular distribution of O. sativa introgressions across the genome and the subpopulation ancestry of each introgression, in combination with the ORSC genetic background that determines the phenotypic outcome. Our evaluation of this ORSC collection provides the foundation for future research to examine the genotype-phenotype relationships for specific traits of interest.
SINE-Codes and Chloroplast Markers as Predictors of Genotypic, Species and Phenotypic Groups
In rice, SINE codes have been associated with life history (annual, intermediate or perennial growth habit) and found useful for distinguishing O. nivara from O. rufipogon (Motohashi et al., 1997; Cheng et al., 2003; Chen et al., 2004; Xu et al., 2007). Kim (2016) developed a SINE code and used it to classify most of the ORSC accessions used in this study (Supplementary Table 2). Using the SINE code, 74.5% of the accessions classified as P1 were identified as perennial (compared to 72.5% of accessions classified as O. rufipogon), and 62.5% of accessions classified as P4 were identified as annual or intermediate (compared to 61.7% classified as O. nivara). In P2/P3, 47.4% of accessions were classified as perennial and 52.6% as annual or intermediate using the SINE code (compared to 23.3% classified as O. rufipogon, 25.6% as O. nivara in P2/P3 with the remainder identified as Oryza spp.). Thus, the SINE-based classifications approximated the species designations in these groups, though they were not entirely concordant.
Kim et al. (2016) further analyzed 286 ORSC accessions for variation at 25 polymorphic sites in the chloroplast genome and identified unique chloroplast haplotypes associated with three wild subpopulation groups located at the geographical extremes of the species range. These may be of interest for investigating refuge populations of ORSC and elucidating phylogenetic relationships among wild populations of Oryza but chloroplast haplotype analysis alone was not robust enough to be useful as a predictor of genetic subpopulation, life habit or species in the ORSC. Nevertheless, the chloroplast data provided clear evidence of gene flow between annual and perennial populations, as well as between ORSC and O. sativa populations, and confirmed that it occurs through both pollen dissemination and seed dispersal (likely facilitated by human migration). Taken together, these data suggest that the population structure of the ORSC is the result of complex evolutionary pathways that intersect and loop back upon each other due to highly permeable ‘species’ boundaries and, as documented in this study, highly plastic phenotypic variation. Information about SINE-code and chloroplast haplotype variation (as determined by Kim et al., 2016) corresponding to each accession is summarized in Supplementary Table 2. These features, along with geographical and ecological information about where each accession was collected, disease and insect resistance, grain quality and additional use-data provided by the IRGC database add value to these genetic resources and enhance our understanding of where they come from and how they might be used in the future.
Emergent Phenotypes
The P2/P3 group is characterized by 43 accessions with trait combinations that form a coherent group, despite the fact that they do not match either of the a priori taxonomic species descriptions. This group is comprised of 29 (67%) admixed ORSC accessions with > 40% of the genome derived from O. sativa but it also contains accessions classified as annual O. nivara or perennial O. rufipogon. The fact that the P2/P3 accessions were collected in diverse ecological and geographic regions, especially from coastal regions of China, Southeast and South Asia (Supplementary Figure 16), and yet share a common suite of emergent phenotypes suggests that particular combinations of traits may evolve repeatedly and independently when annual, perennial and intermediate forms of common wild rice come together as sympatric swarms in unsupervised settings. The patterns of admixture observed in this group suggest that diverse ORSC populations have hybridized among themselves and with local populations of O. sativa, giving rise to forms of trait variation not observed in the parental populations. In rice, several lines of evidence suggest that annual and intermediate forms have emerged repeatedly from genetically and geographically diverse populations of perennial ancestors in response to changing patterns of temperature, rainfall and CO2 (Grillo et al., 2009; Banaticla-Hilario et al., 2013a,b; Liu et al., 2015). The ORSC populations examined here provide opportunities to deepen our understanding of incipient speciation and to identify mechanisms by which annual life forms may evolve from perennial ancestors in response to changes in the environment. They also provide material for examining what kinds of selection pressure(s) are associated with a shift toward the annual, early-flowering, seed-bearing habit or conversely, serve to maintain the perennial, stoloniferous, late-flowering and vegetatively vigorous habit. During times of climate change, a strategy of balancing selection to maintain components of annual, intermediate and perennial life forms may be favored by evolution to allow for the emergence of new resilience mechanisms. We have a lot to learn from the existence of these dynamic ORSC populations. They have survived many waves of climate change in the past and are likely to hold secrets about survival strategies for the future.
Data Availability Statement
The original contributions presented in this study are included in the article/Supplementary Material, further inquiries can be directed to the corresponding author/s.
Author Contributions
KM, MEN, MB-H, GCE, HJK, JJ, SH, JK, and LH phenotyped the plants. YS managed the data. AG, JE, GCE, HJK, JJ, and SRM analyzed the data. GCE, AG, JE, and SRM wrote the manuscript. SRM conceptualized the project. All authors contributed to the article and approved the submitted version.
Funding
This study was funded in part by the National Science Foundation with grants to SRM and GCE (NSF-PGRP nos. 0606461 and 1026555). Mention of a trademark or proprietary product does not constitute a guarantee or warranty of the product by the US Department of Agriculture and does not imply its approval to the exclusion of other products that also can be suitable. The USDA is an equal opportunity provider and employer.
Conflict of Interest
AG is employed by Bayesic Research LLC.
The remaining authors declare that the research was conducted in the absence of any commercial or financial relationships that could be construed as a potential conflict of interest.
Publisher’s Note
All claims expressed in this article are solely those of the authors and do not necessarily represent those of their affiliated organizations, or those of the publisher, the editors and the reviewers. Any product that may be evaluated in this article, or claim that may be made by its manufacturer, is not guaranteed or endorsed by the publisher.
Acknowledgments
The excellent technical assistance of Daniel E. Wood in collecting the phenotypic data and the assistance of Teresa A. Hancock with organizing and conducting the preliminary analyses of the data collected at the Dale Bumpers National Rice Research Center, is acknowledged. The assistance of Aaron K. Jackson with the manuscript references is acknowledged.
Supplementary Material
The Supplementary Material for this article can be found online at: https://www.frontiersin.org/articles/10.3389/fpls.2022.787703/full#supplementary-material
Footnotes
- ^ https://gringlobal.irri.org/gringlobal/search
- ^ https://shigen.nig.ac.jp/rice/oryzabase/strain/wildCore/list
- ^ https://github.com/tonymugen/MuGen
- ^ https://github.com/tonymugen/MuGaMix
- ^ https://github.com/davidsjoberg/ggsankey
References
Banaticla-Hilario, M. C. N., Sosef, M. S. M., McNally, K. L., Hamilton, N. R. S., and van den Berg, R. G. (2013a). Ecogeographic variation in the morphology of two Asian wild rice species, Oryza nivara and Oryza rufipogon. Int. J. Plant Sci. 174, 896–909. doi: 10.1086/670370
Banaticla-Hilario, M. C., van den Berg, R. G., Hamilton, N. R., and McNally, K. L. (2013b). Local differentiation amidst extensive allele sharing in Oryza nivara and O. rufipogon. Ecol. Evol. 3, 3047–3062. doi: 10.1002/ece3.689
Barbier, P. (1989a). Genetic variation and ecotypic differentiation in the wild rice species Oryza rufipogon. I. Population differentiation in life-history traits and isozymic loci. Jpn. J. Genet. 64, 259–271. doi: 10.1266/jjg.64.259
Barbier, P. (1989b). Genetic variation and ecotypic differentiation in the wild rice species Oryza rufipogon II. Influence of the mating system and life-history traits on the genetic structure of populations. Jpn. J. Genet. 64, 273–285. doi: 10.1266/jjg.64.273
Barbier, P., Morishima, H., and Ishihama, A. (1991). Phylogenetic relationships of annual and perennial wild rice: probing by direct DNA sequencing. Theor. Appl. Genet. 81, 693–702. doi: 10.1007/bf00226739
Bioversity International, IRRI, and Africa Rice Center (2007). Descriptors for Wild and Cultivated Rice (Oryza spp.). Rome: Bioversity International.
Browning, B. L., Zhou, Y., and Browning, S. R. (2018). A one-penny imputed genome from next-generation reference panels. Am. J. Hum. Genet. 103, 338–348. doi: 10.1016/j.ajhg.2018.07.015
Cai, H. W., Wang, X. K., and Morishima, H. (2004). Comparison of population genetic structures of common wild rice (Oryza rufipogon Griff.), as revealed by analyses of quantitative traits, allozymes, and RFLPs. Heredity (Edinb.) 92, 409–417. doi: 10.1038/sj.hdy.6800435
Chang, T. T. (1976). The origin, evolution, cultivation, dissemination, and diversification of Asian and African rices. Euphytica 25, 425–441. doi: 10.1007/BF00041576
Chatterjee, D. (1948). A modified key and enumeration of the species of Oryza Linn. Indian J. Agric. Sci. 18, 185–192.
Chen, L. J., Lee, D. S., Song, Z. P., Suh, H. S., and Lu, B. R. (2004). Gene flow from cultivated rice (Oryza sativa) to its weedy and wild relatives. Ann. Bot. 93, 67–73. doi: 10.1093/aob/mch006
Cheng, C., Motohashi, R., Tsuchimoto, S., Fukuta, Y., Ohtsubo, H., and Ohtsubo, E. (2003). Polyphyletic origin of cultivated rice: based on the interspersion pattern of SINEs. Mol. Biol. Evol. 20, 67–75. doi: 10.1093/molbev/msg004
Choi, J. Y., and Purugganan, M. D. (2018). Multiple origin but single domestication led to Oryza sativa. G3 8, 797–803. doi: 10.1534/g3.117.300334
Civán, P., Craig, H., Cox, C. J., and Brown, T. A. (2015). Three geographically separate domestications of Asian rice. Nat. Plants 1:15164. doi: 10.1038/nplants.2015.164
Cooper, L., Meier, A., Laporte, M. A., Elser, J. L., Mungall, C., Sinn, B. T., et al. (2018). The Planteome database: an integrated resource for reference ontologies, plant genomics and phenomics. Nucleic Acids Res. 46, D1168–D1180. doi: 10.1093/nar/gkx1152
Danecek, P., Bonfield, J. K., Liddle, J., Marshall, J., Ohan, V., Pollard, M. O., et al. (2021). Twelve years of SAMtools and BCFtools. Gigascience 10:giab008. doi: 10.1093/gigascience/giab008
Gelman, A., Carlin, J. B., Stern, H. S., and Rubin, D. B. (2004). Bayesian Data Analysis. Boca Raton, FL: CRC Press.
Greenberg, A. J., Hackett, S. R., Harshman, L. G., and Clark, A. G. (2010). A hierarchical Bayesian model for a novel sparse partial diallel crossing design. Genetics 185, 361–373. doi: 10.1534/genetics.110.115055
Greenberg, A. J., Hackett, S. R., Harshman, L. G., and Clark, A. G. (2011). Environmental and genetic perturbations reveal different networks of metabolic regulation. Mol. Syst. Biol. 7:563. doi: 10.1038/msb.2011.96
Grillo, M. A., Li, C., Fowlkes, A. M., Briggeman, T. M., Zhou, A., Schemske, D. W., et al. (2009). Genetic architecture for the adaptive origin of annual wild rice, Oryza nivara. Evolution 63, 870–883. doi: 10.1111/j.1558-5646.2008.00602.x
Hill, R. (2010). The cultivation of perennial rice, an early phase in Southeast Asian agriculture? J. Hist. Geogr. 36, 215–223. doi: 10.1016/j.jhg.2009.09.001
Hoffman, G. E. (2013). Correcting for population structure and kinship using the linear mixed model: theory and extensions. PLoS One 8:e75707. doi: 10.1371/journal.pone.0075707
Huang, X., Kurata, N., Wei, X., Wang, Z.-X., Wang, A., Zhao, Q., et al. (2012). A map of rice genome variation reveals the origin of cultivated rice. Nature 490, 497–501. doi: 10.1038/nature11532
Jung, J. K. H. (2016). Scientific Capacity Building: Enhancing our Understanding of Wild Rice Germplasm and Human Resource Development. Doctoral dissertation. Ithaca, NY: Cornell University.
Kang, H. M., Sul, J. H., Service, S. K., Zaitlen, N. A., Kong, S.-Y., Freimer, N. B., et al. (2010). Variance component model to account for sample structure in genome-wide association studies. Nat. Genet. 42, 348–354. doi: 10.1038/ng.548
Kennedy, A. B. W., and Sankey, H. R. (1898). The thermal efficiency of steam engines. Report of the committee appointed to the council upon the subject of the definition of a standard or standards of thermal efficiency for steam engines: with an introductory note. Minutes Proc. Inst. Civil Eng. 134, 278–312. doi: 10.1680/imotp.1898.19100
Kim, H. (2016). Genetic Characterization of the O. rufipogon Species Complex and Construction of Interspecific Pre-Breeding Resources for the Rice Improvement. Doctoral dissertation. Ithaca, NY: Cornell University.
Kim, H., Jung, J., Singh, N., Greenberg, A., Doyle, J. J., Tyagi, W., et al. (2016). Population dynamics among six major groups of the Oryza rufipogon species complex, wild relative of cultivated Asian rice. Rice (N. Y.) 9:56. doi: 10.1186/s12284-016-0119-0
Kurata, N., and Yamazaki, Y. (2006). Oryzabase. An integrated biological and genome information database for rice. Plant Physiol. 140, 12–17. doi: 10.1104/pp.105.063008
Kuroda, Y., Sato, Y.-I., Bounphanousay, C., Kono, Y., and Tanaka, K. (2006). Genetic structure of three Oryza AA genome species (O. rufipogon, O. nivara and O. sativa) as assessed by SSR analysis on the Vientiane Plain of Laos. Conserv. Genet. 8, 149–158. doi: 10.1007/s10592-006-9156-3
Liu, R., Zheng, X. M., Zhou, L., Zhou, H. F., and Ge, S. (2015). Population genetic structure of Oryza rufipogon and Oryza nivara: implications for the origin of O. nivara. Mol. Ecol. 24, 5211–5228. doi: 10.1111/mec.13375
Londo, J. P., Chiang, Y.-C., Hung, K.-H., Chiang, T.-Y., and Schaal, B. A. (2006). Phylogeography of Asian wild rice, Oryza rufipogon, reveals multiple independent domestications of cultivated rice, Oryza sativa. Proc. Natl. Acad. Sci. U.S.A. 103, 9578–9583. doi: 10.1073/pnas.0603152103
Lynch, M., and Walsh, B. (1998). Genetics and Analysis of Quantitative Traits. Sunderland, MA: Sinauer Associates, Inc.
Maples, B. K., Gravel, S., Kenny, E. E., and Bustamante, C. D. (2013). RFMix: a discriminative modeling approach for rapid and robust local-ancestry inference. Am. J. Hum. Genet. 93, 278–288. doi: 10.1016/j.ajhg.2013.06.020
McGrory, C. A., and Titterington, D. M. (2007). Variational approximations in Bayesian model selection for finite mixture distributions. Comput. Stat. Data Anal. 51, 5352–5367. doi: 10.1016/j.csda.2006.07.020
Morishima, H. (2001). “Evolution and domestication of rice,” in Proceedings of the 4th International Rice Genetics Symposium Rice Genetics IV, eds G. S. Khush, D. S. Brar, and B. Hardy (Los Baños, PH: International Rice Research Institute), 63–77. doi: 10.1142/9789812814296_0004
Morishima, H., Oka, H., and Chang, W. (1961). Directions of differentiation in populations of wild rice, Oryza perennis and O. sativa F. spontanea. Evolution (N. Y.) 15, 326–339. doi: 10.1111/j.1558-5646.1961.tb03158.x
Morishima, H., Sano, Y., and Oka, H. I. (1984). Differentiation of perennial and annual types due to habitat conditions in the wild rice Oryza perennis. Plant Syst. Evol. 144, 119–135. doi: 10.1007/BF00986670
Motohashi, R., Mochizuki, K., Ohtsubo, H., and Ohtsubo, E. (1997). Structures and distribution of p-SINE1 members in rice genomes. Theor. Appl. Genet. 95, 359–368. doi: 10.1007/s001220050571
Oka, H. (1974). Analysis of genes controlling F1 sterility in rice by the use of isogenic lines. Genetics 77, 521–534. doi: 10.1093/genetics/77.3.521
Oka, H. I., and Morishima, H. (1967). Variations in the breeding system of a wild rice, Oryza perennis. Evolution 21, 249–258. doi: 10.1111/j.1558-5646.1967.tb00153.x
Raj, A., Stephens, M., and Pritchard, J. K. (2014). fastSTRUCTURE: variational inference of population structure in large SNP data sets. Genetics 197, 573–589. doi: 10.1534/genetics.114.164350
Robert, C. P. (1996). “Mixtures of distributions: inference and estimation,” in Markov Chain Monte Carlo in Practice, eds W. R. Gilks, S. Richardson, and D. J. Spiegelhalter (Boca Raton, FL: Chapman and Hall/CRC), 441–464.
Roschevicz, R. J. (1931). A contribution to the knowledge of rice. Appl. Bot. Genet. Pl. Breed. Bull. 27, 3–133.
Samal, R., Roy, P. S., Sahoo, A., Kar, M. K., Patra, B. C., Marndi, B. C., et al. (2018). Morphological and molecular dissection of wild rices from eastern India suggests distinct speciation between O. rufipogon and O. nivara populations. Sci. Rep. 8:2773. doi: 10.1038/s41598-018-20693-7
Sano, Y., Morishima, H., and Oka, H.-I. (1980). Intermediate perennial-annual populations of Oryza perennis found in Thailand and their evolutionary significance. Bot. Mag. 93, 291–305. doi: 10.1007/BF02488735
Sharma, S. (2003). “Species of genus Oryza and their interrelationships,” in Monograph on Genus Oryza, J. S. Nanda and S. D. Sharma (Enfield, NH: Science Publishers).
Sharma, S., and Shastry, S. (1965). Taxonomic studies in Genus Oryza I. Asiatic types of sativa complex. Indian J. Genet. Plant Breed. 25, 245–259.
VanRaden, P. M. (2008). Efficient methods to compute genomic predictions. J. Dairy Sci. 91, 4414–4423. doi: 10.3168/jds.2007-0980
Vaughan, D. A. (1989). The genus Oryza L.: current status of taxonomy. IRRI Res. Pap. Ser. 138, 1–21.
Vaughan, D. A. (1994). The Wild Relatives of Rice: A Genetic Resources Handbook. Los Banos, PH: International Rice Research Institute.
Vaughan, D. A., Lu, B.-R., and Tomooka, N. (2008). Was Asian rice (Oryza sativa) domesticated more than once? Rice 1, 16–24. doi: 10.1007/s12284-008-9000-0
Vaughan, D. A., Morishima, H., and Kadowaki, K. (2003). Diversity in the Oryza genus. Curr. Opin. Plant Biol. 6, 139–146. doi: 10.1016/s1369-5266(03)00009-8
Vaughan, L. K., Ottis, B. V., Prazak-Havey, A. M., Bormans, C. A., Sneller, C., Chandler, J. M., et al. (2001). Is all red rice found in commercial rice really Oryza sativa? Weed Sci. 49, 468–476.
Wang, H., Vieira, F. G., Crawford, J. E., Chu, C., and Nielsen, R. (2017). Asian wild rice is a hybrid swarm with extensive gene flow and feralization from domesticated rice. Genome Res. 27, 1029–1038. doi: 10.1101/gr.204800.116
Wang, H., Xu, X., Vieira, F. G., Xiao, Y., Li, Z., Wang, J., et al. (2016). The power of inbreeding: NGS-based GWAS of rice reveals convergent evolution during rice domestication. Mol. Plant 9, 975–985. doi: 10.1016/j.molp.2016.04.018
Xu, J. H., Cheng, C., Tsuchimoto, S., Ohtsubo, H., and Ohtsubo, E. (2007). Phylogenetic analysis of Oryza rufipogon strains and their relations to Oryza sativa strains by insertion polymorphism of rice SINEs. Genes Genet. Syst. 82, 217–229. doi: 10.1266/ggs.82.217
Yamazaki, Y., Sakaniwa, S., Tsuchiya, R., Nonomura, K.-I., and Kurata, N. (2010). Oryzabase: an integrated information resource for rice science. Breed. Sci. 60, 544–548. doi: 10.1270/jsbbs.60.544
Keywords: rice, Bayesian Gaussian mixture models, Oryza rufipogon, Oryza sativa, Oryza nivara, genebank accessions, crop wild relatives, Oryza rufipogon species complex
Citation: Eizenga GC, Kim HJ, Jung JKH, Greenberg AJ, Edwards JD, Naredo MEB, Banaticla-Hilario MCN, Harrington SE, Shi Y, Kimball JA, Harper LA, McNally KL and McCouch SR (2022) Phenotypic Variation and the Impact of Admixture in the Oryza rufipogon Species Complex (ORSC). Front. Plant Sci. 13:787703. doi: 10.3389/fpls.2022.787703
Received: 01 October 2021; Accepted: 13 April 2022;
Published: 13 June 2022.
Edited by:
Anna Maria Mastrangelo, Research Centre for Cereal and Industrial Crops, Council for Agricultural and Economics Research (CREA), ItalyReviewed by:
Ryo Ishikawa, Kobe University, JapanRobert Henry, The University of Queensland, Australia
Copyright © 2022 At least a portion of this work is authored by Georgia C. Eizenga and Jeremy D. Edwards on behalf of the U.S. Government and as regards Dr. Eizenga, Dr Edwards and the U.S. Government, is not subject to copyright protection in the United States. Foreign and other copyrights may apply.. This is an open-access article distributed under the terms of the Creative Commons Attribution License (CC BY). The use, distribution or reproduction in other forums is permitted, provided the original author(s) and the copyright owner(s) are credited and that the original publication in this journal is cited, in accordance with accepted academic practice. No use, distribution or reproduction is permitted which does not comply with these terms.
*Correspondence: Georgia C. Eizenga, georgia.eizenga@usda.gov; orcid.org/0000-0003-0330-9225; Susan R. McCouch, srm4@cornell.edu; orcid.org/0000-0001-9246-3106
†Present addresses: HyunJung Kim, LG Chemical Ltd., Seoul, South Korea; Maria Elizabeth B. Naredo, Philippine Coconut Authority – Albay Research Center, Guinobatan, Philippines; Jennifer A. Kimball, University of Minnesota-Twin Cities, St. Paul, MN, United States
‡These authors share first authorship